How much CO2 has been emitted in my lifetime?
- N.B.1: 14 July 2025: I originally posted this on 12 August 2024. But the content is now new and improved.
- N.B.2: A small discussion can be found underneath this Lemmy post.
- N.B.3: To skip the explanation, and immediately create and download your own version of the new graph, click here: https://mishathings.org/co2-graph. It runs on a small server, so you might need to have a bit of patience. Also it works better on a desktop/laptop than on a phone 😬).
A powerful but problematic graph#
For some years now, I have seen this graph go around on social media. I think it’s a powerful image, because it shows us so clearly that it is happening in our lifetime and under our watch.
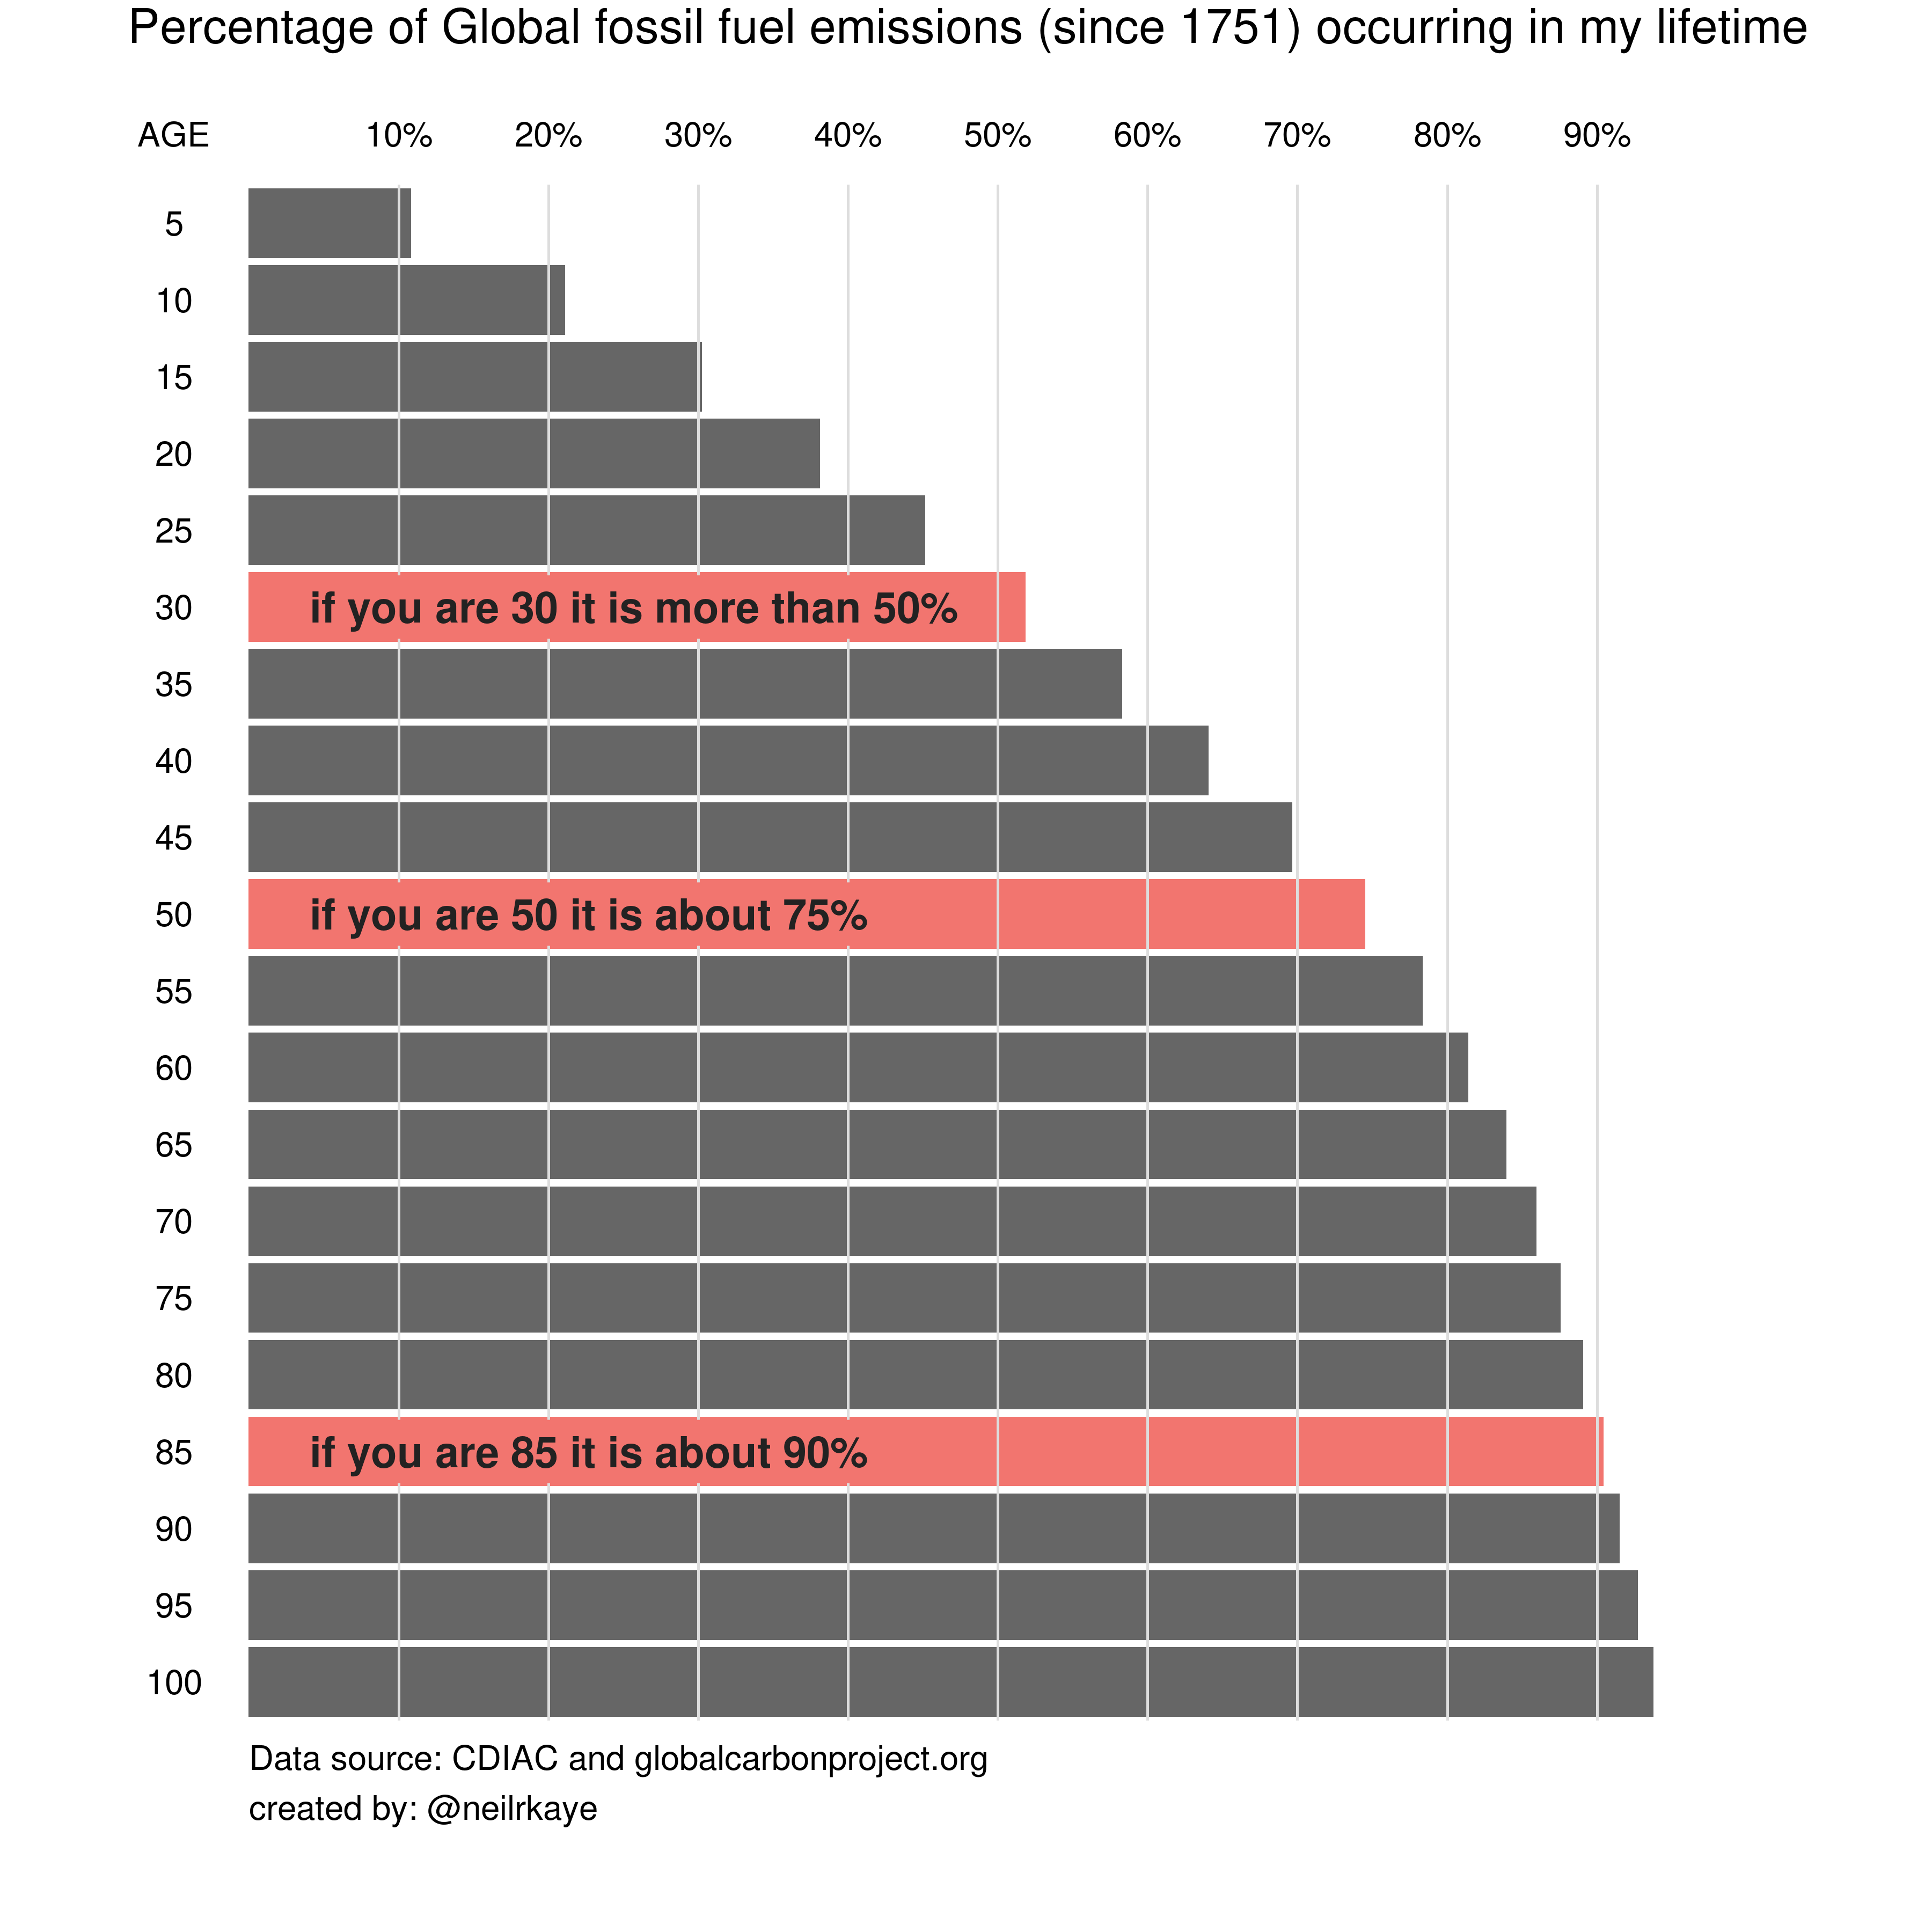
For that reason, I have also used it in some of my classes, yet always with the disclaimer the the graph does not show when it was made.
Because that can be a problem: the graph might show us that if you are currently 30 years old, 50% of all the CO2 that has been emitted since 1751 has been emitted in your lifetime. But that percentage can change over time.
Let’s be hopeful, and imagine some 30-year olds looking at this graph in the year 2100: “what do you mean 50% of all the CO2 that has been emitted since 1751 has been emitted in my lifetime!? We achieved global net zero before I was born! When was this graph made anyway?”
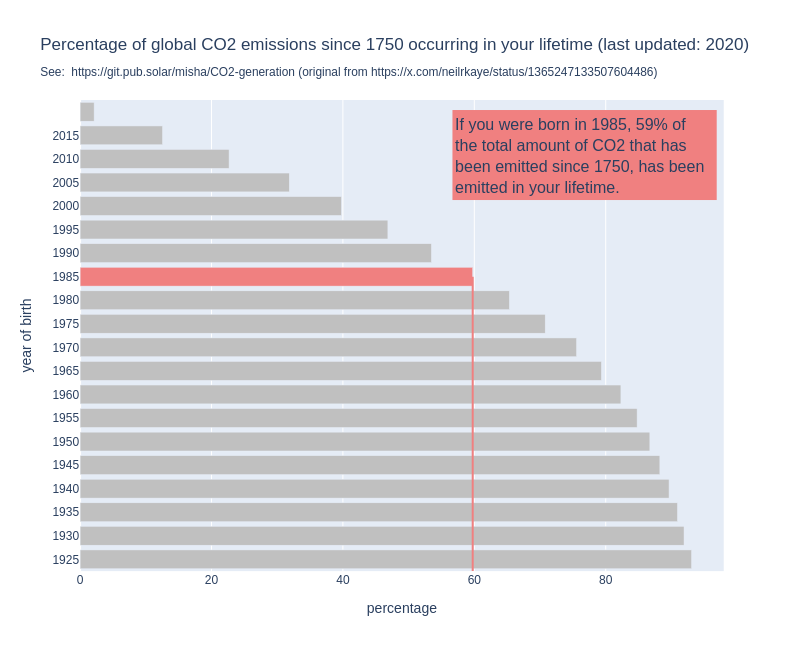
To prevent this confusion, I decided to build a new version of the graph that is more transparent and future proof:
- First, it clearly indicates in the title how recent the data is.
- Next, I use “year of birth” on the y-axis, instead of “age”. This way, you don’t have to figure out how old you were in the year of the most recent data.
- Also, I have added a url to the graph that links to the public git repo with the code, so anyone can update the graph whenever there is more data available.
The code looks like this and is freely available for anyone to explore and play with.
An interactive version of the graph, where you can pick your year of birth and download the personalized image, can be found here (works best on desktop): https://mishathings.org/co2-graph
The result will kind of look like this:
But the results are the same?#
Interestingly, the percentages shown in the new, updated graph are quite similar the ones of the original graph, despite the fact that the latter must be at least five (and probably more) years older.
- People who were 85 in 2023, and were thus born in 1938 get a percentage of 90% (vs “about 90%” in the original graph).
- People who were 50 in 2023, and were thus born in 1973 get a percentage of 73% (vs “about 75% in the original graph)
- People who were 30 in 2023, and were thus born in 1993 get a percentage of 51% (vs “about 50% in the original graph)
This led me into a quite a rabbit hole: how would you expect the percentages to change?
Intuitively you might expect the percentage to go up;1 after all, someone who was 30 in 2023 has lived through a larger absolute increase in total CO2 emissions than someone who was 30 in 1990. But this misses the fact that the “total amount of emissions since 1750” - which both these absolute increases would be divided by - was also much larger in 2023 than it was in 1990.
In the end, after spending quite some time in the rabbit hole, I came the conclusion that, as long as the average growth rate of the annual CO2 emissions remains more or less stable, the percentages are likely to remain quite stable as well.
In fact, it is only when the growth rate of the annual CO2 emmissions changes that the percentages of my new, updated graph start differing from the original one.
Bottom line#
I invite you all to follow me in actual the rabbit hole, but if you’re not in the mood for math and python, I leave you with this general conclusion:
As long as the average growth rate of the annual CO2 emissions remains stable, my new, updated graph will probably keep showing the same percentages as the original graph. The only way for my new, updated graph to tell a new, different story than the original graph, is if we manage to truly bring the average growth rate of the annual CO2 emissions down.2
So, if you needed an extra reason to break the system that causes the emissions to go up with a steady 2.84% per year, this could be it! Please help make this graph useful!
Comments
You can use your Fediverse (i.e. Mastodon, among many others) account to reply to this post/account.