System Earth 3a
Atmosphere III
Misha Velthuis
m.velthuis@uva.nl
Tue 17 Sept 2024
Today
Quiz (20 minutes)
Answers to quiz
Recap
Atmosphere III
Quiz
Recap: last Thursday
Geostrophic wind
Simple global model of air flow
Adding continents and oceans
Adding water vapour (first intro)
Recap: questions/ remarks
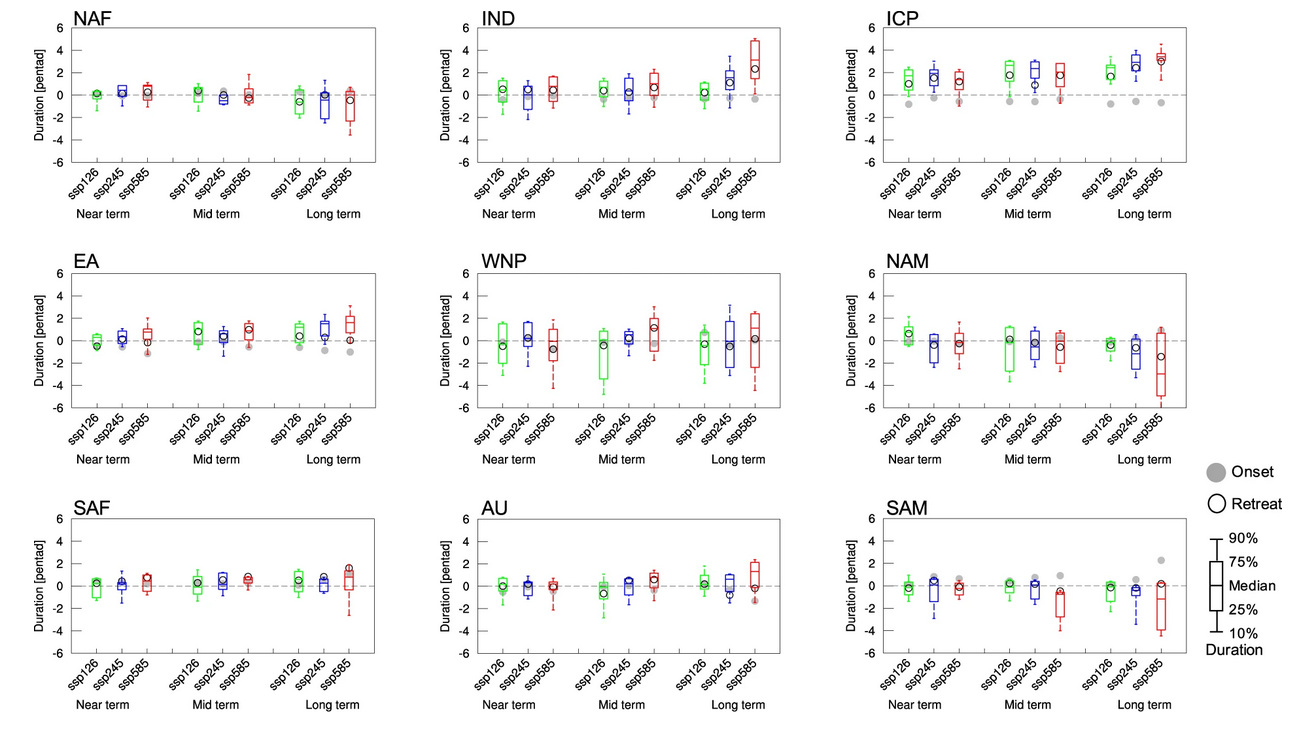
Does climate change affect
the duration of the monsoon in India?
Amount
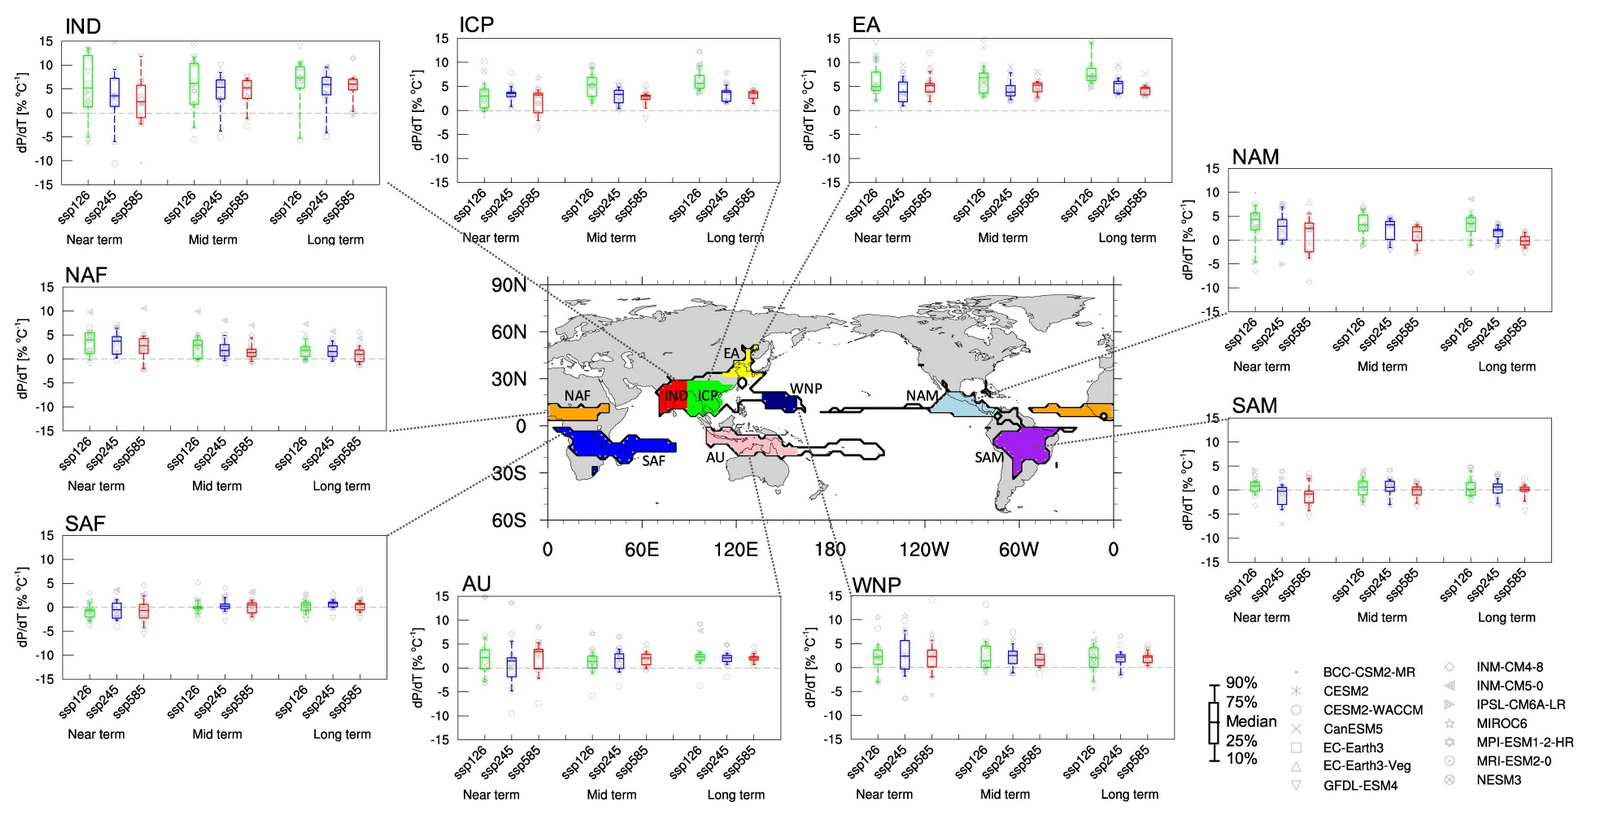
By the way…
Duration
Atmosphere III
Saturation vapor pressure (end)
Latent heat
Reasons for uplift
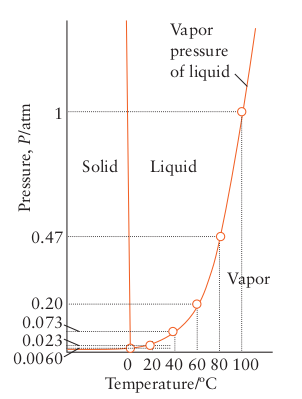
Saturation vapor pressure
Saturation vapor pressure
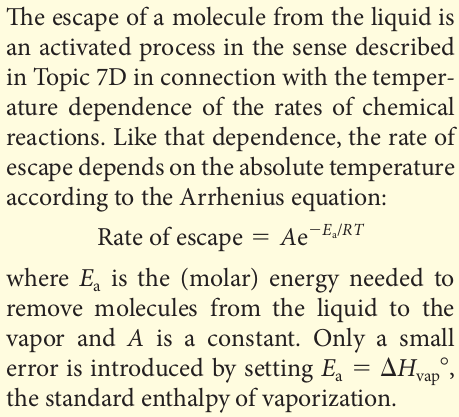
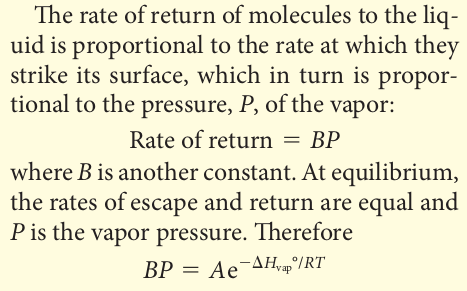
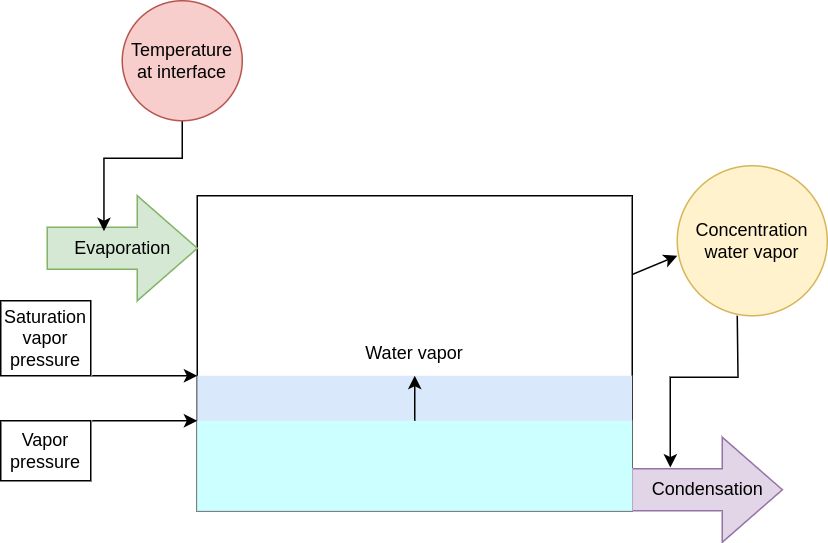
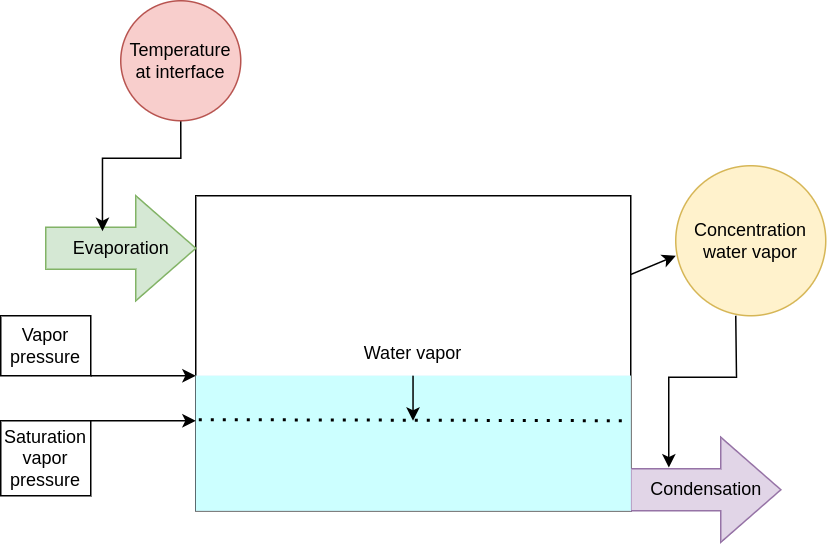
Saturation vapor pressure = dynamic equilibrium
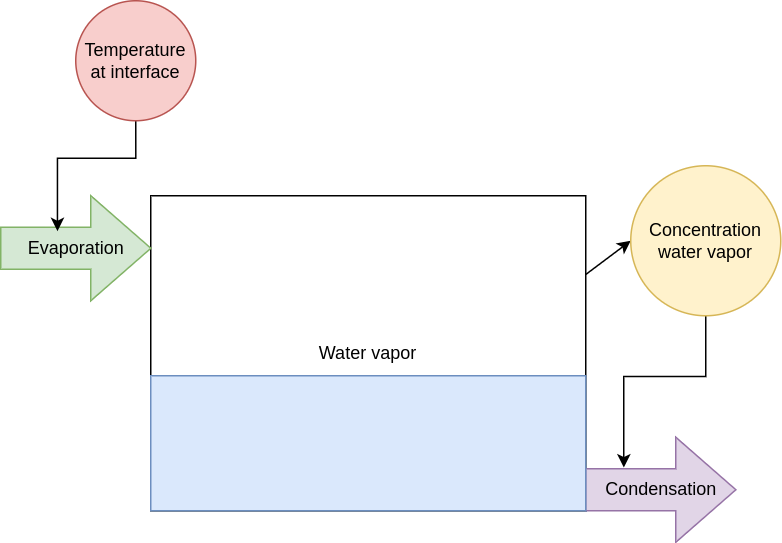
vapor pressure < saturation vapor pressure
vapor pressure > saturation vapor pressure
Saturation vapor pressure
Why does it rain when air rises?
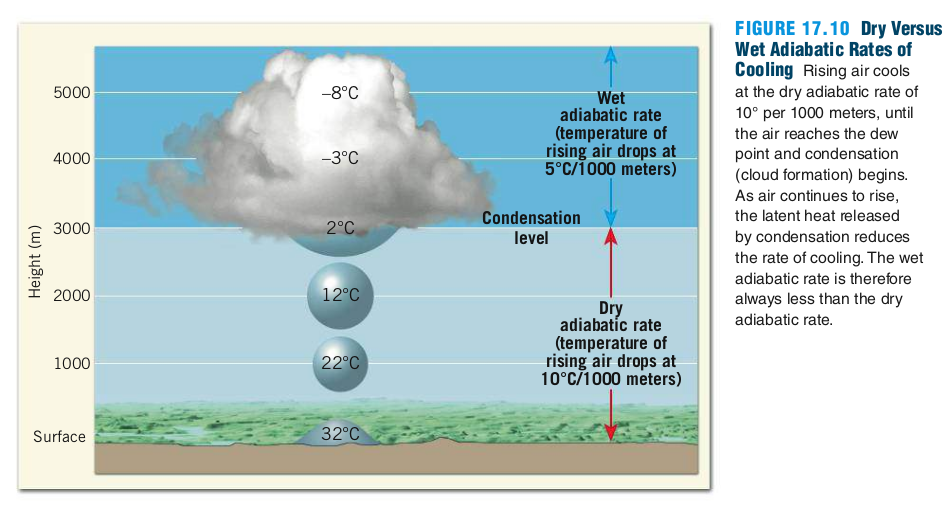
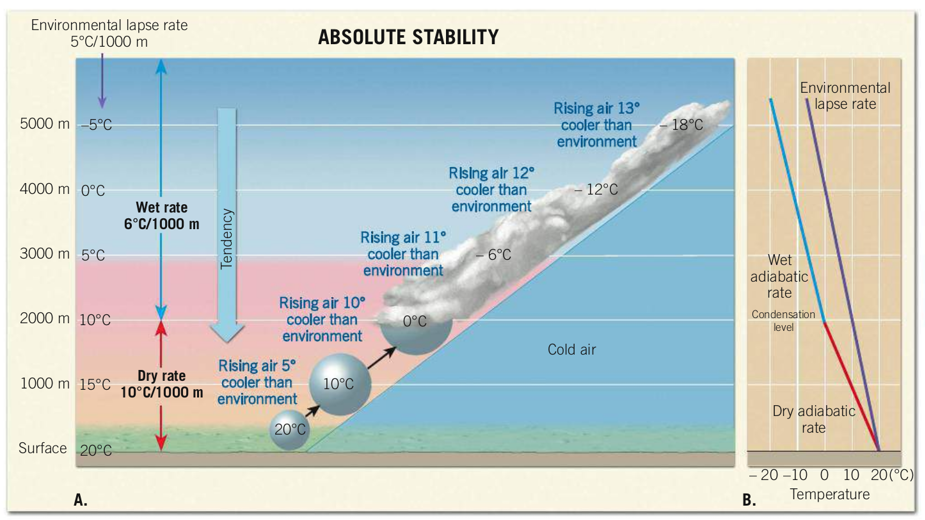
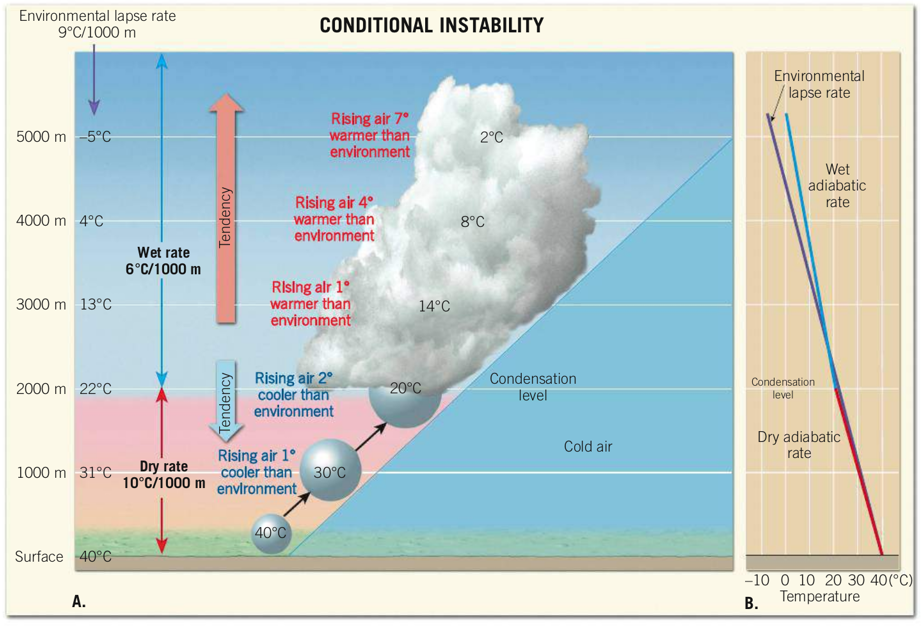
As air rises, it cools
Air rises, it cools, it rains
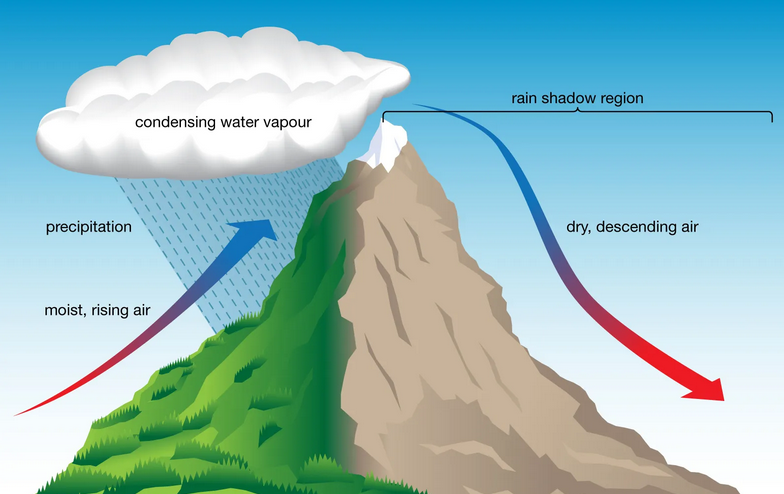
Reasons for uplift
Orographic uplift
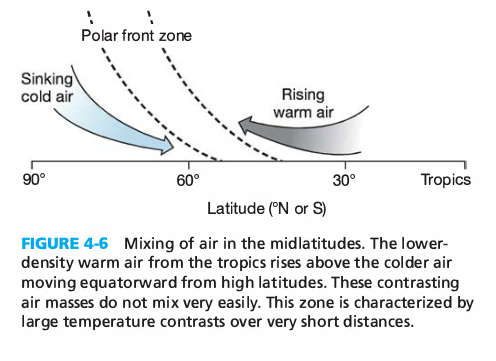
Mixing of different densities (front)
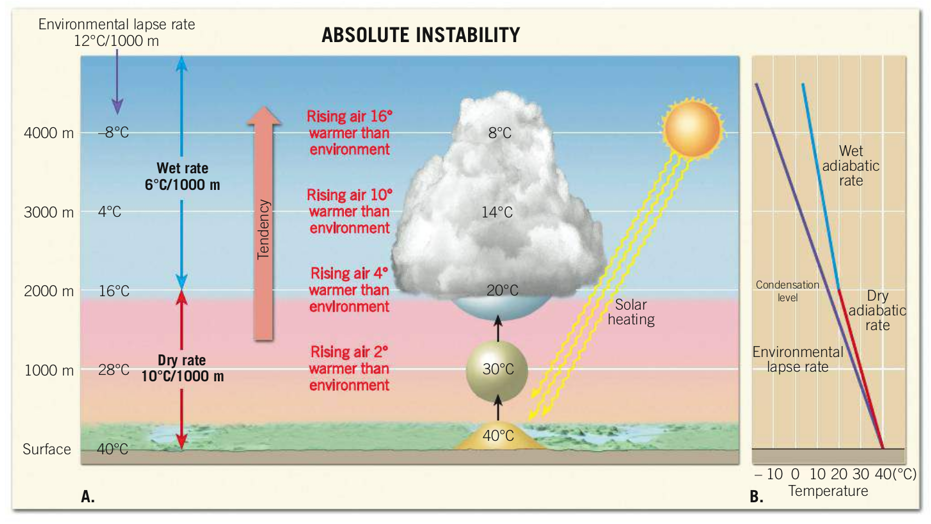
Convection
But first: latent heat
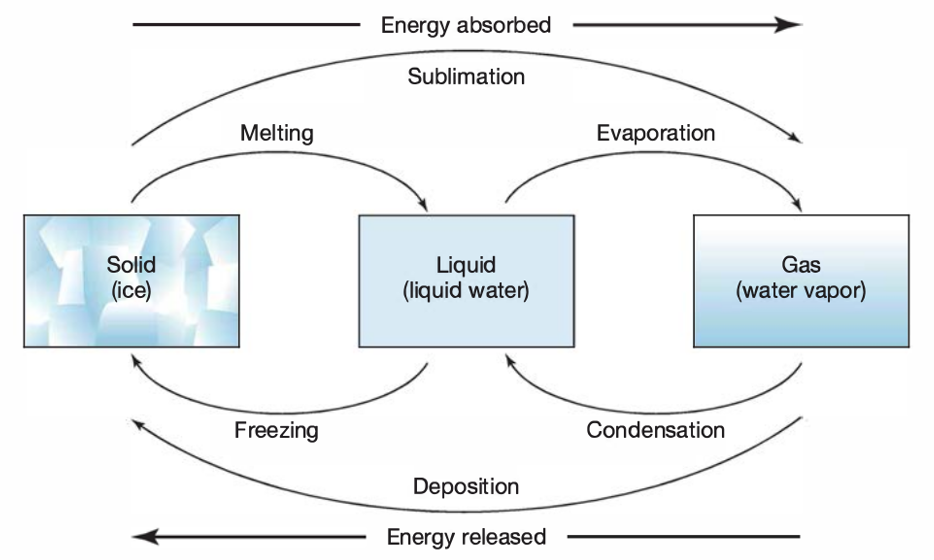
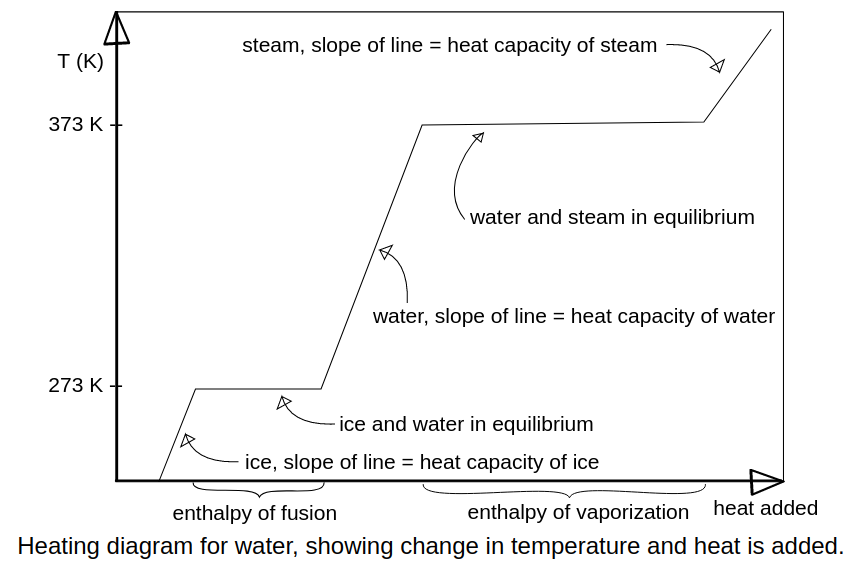
Latent heat
Phase changes
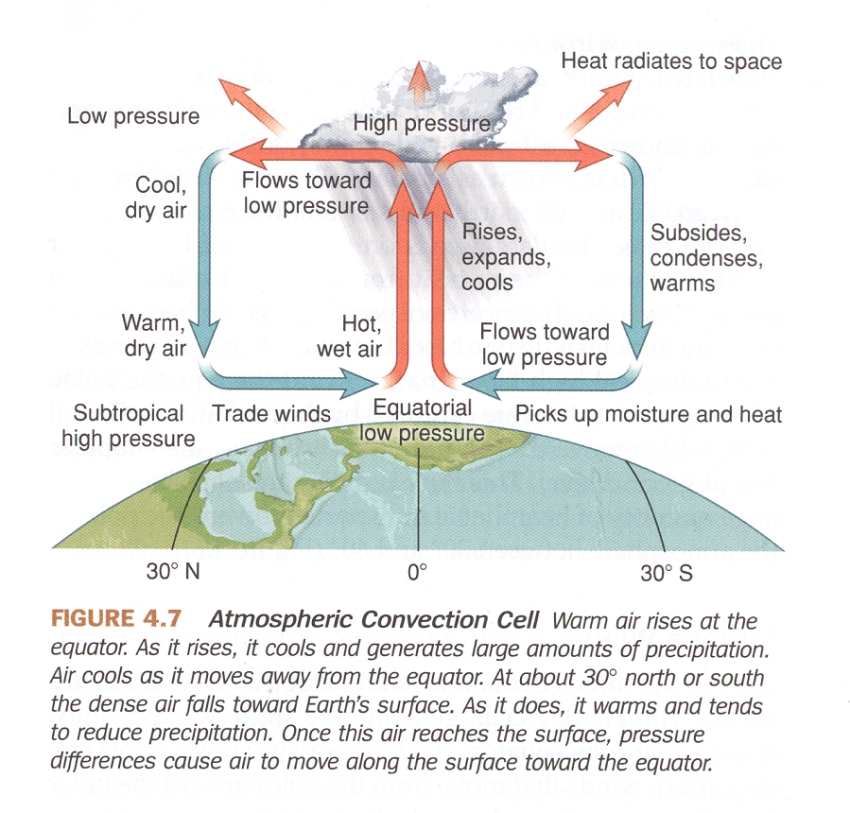
Convection at ITCZ
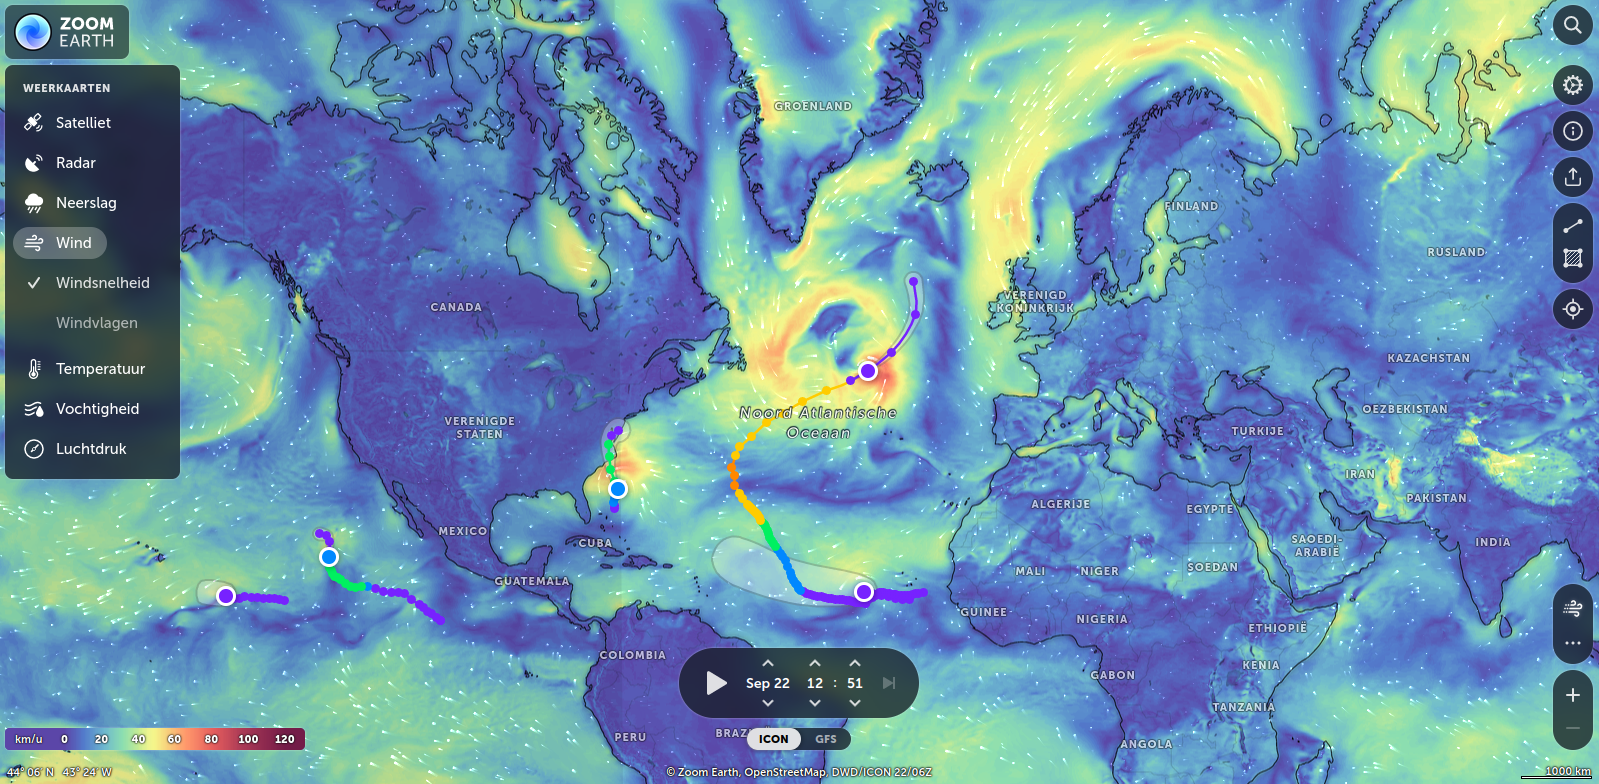
Hurricanes
Third reason for uplift: convection
New concepts: dry and wet adiabatic cooling
Next time: