3a: Intro to the Energy Transition
Low carbon technologies (generation)
Misha Velthuis
m.velthuis@uva.nl
Monday 16 Sept 2024
Today
Low carbon technologies in context
Getting a feel for energy units
Coal to gas, CSS, nuclear
Wind, solar, hydro
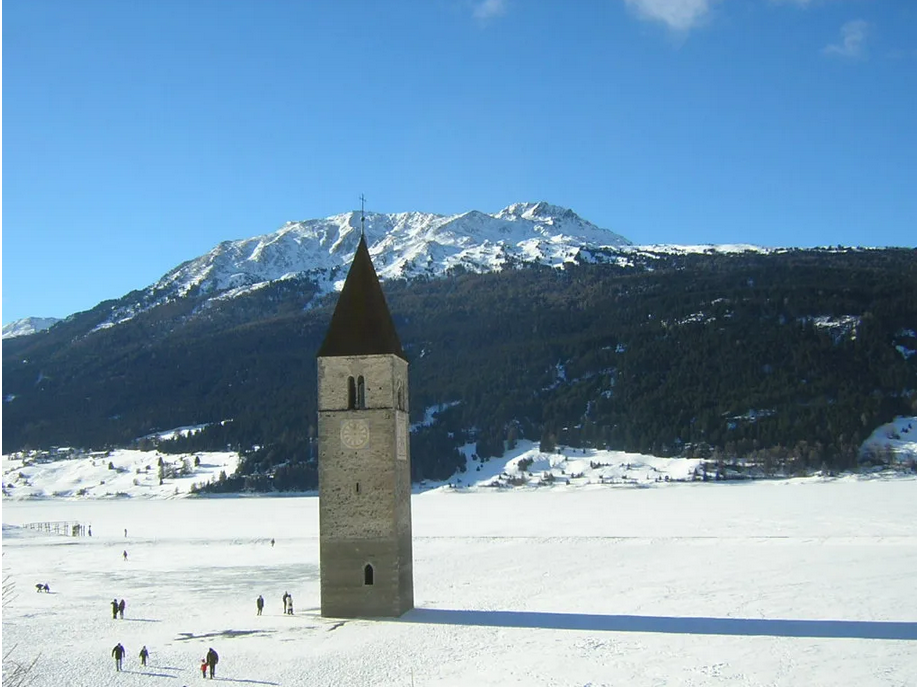
The story so far …
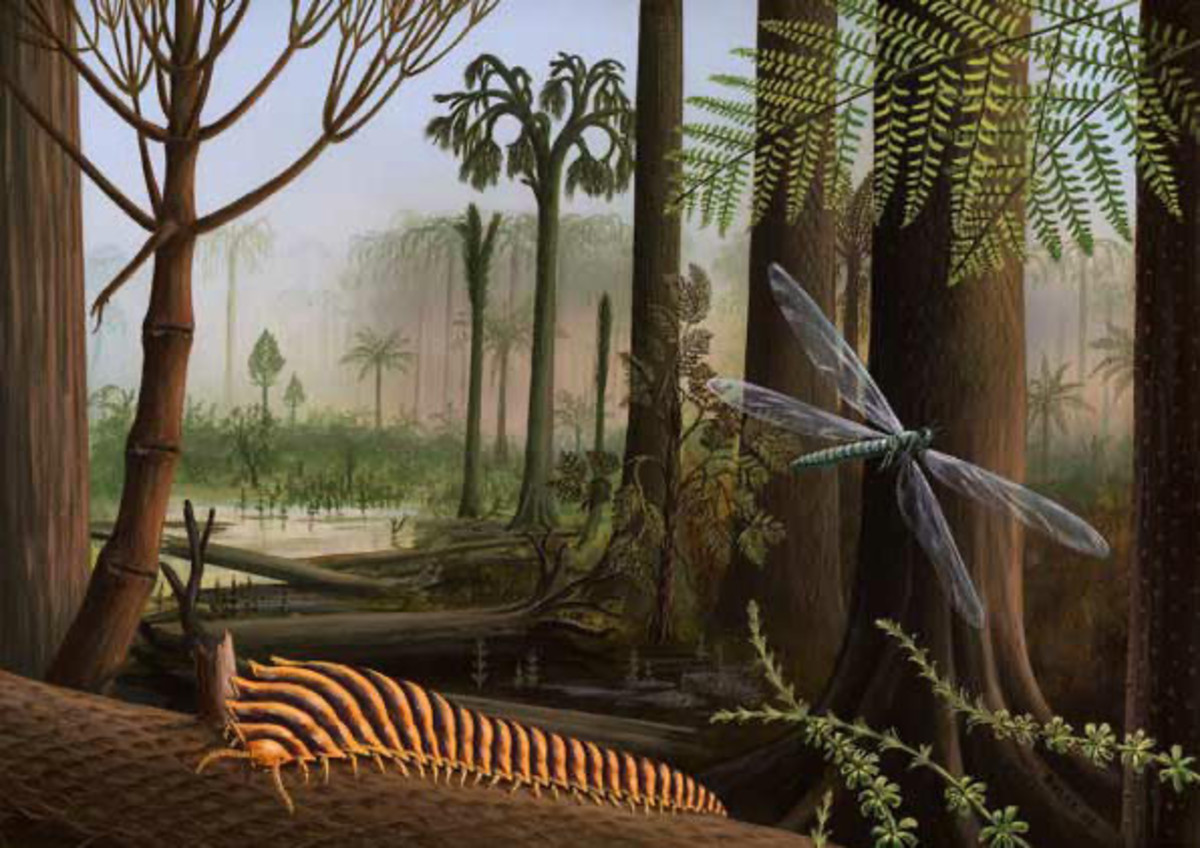
(in the carboniferous (image), but
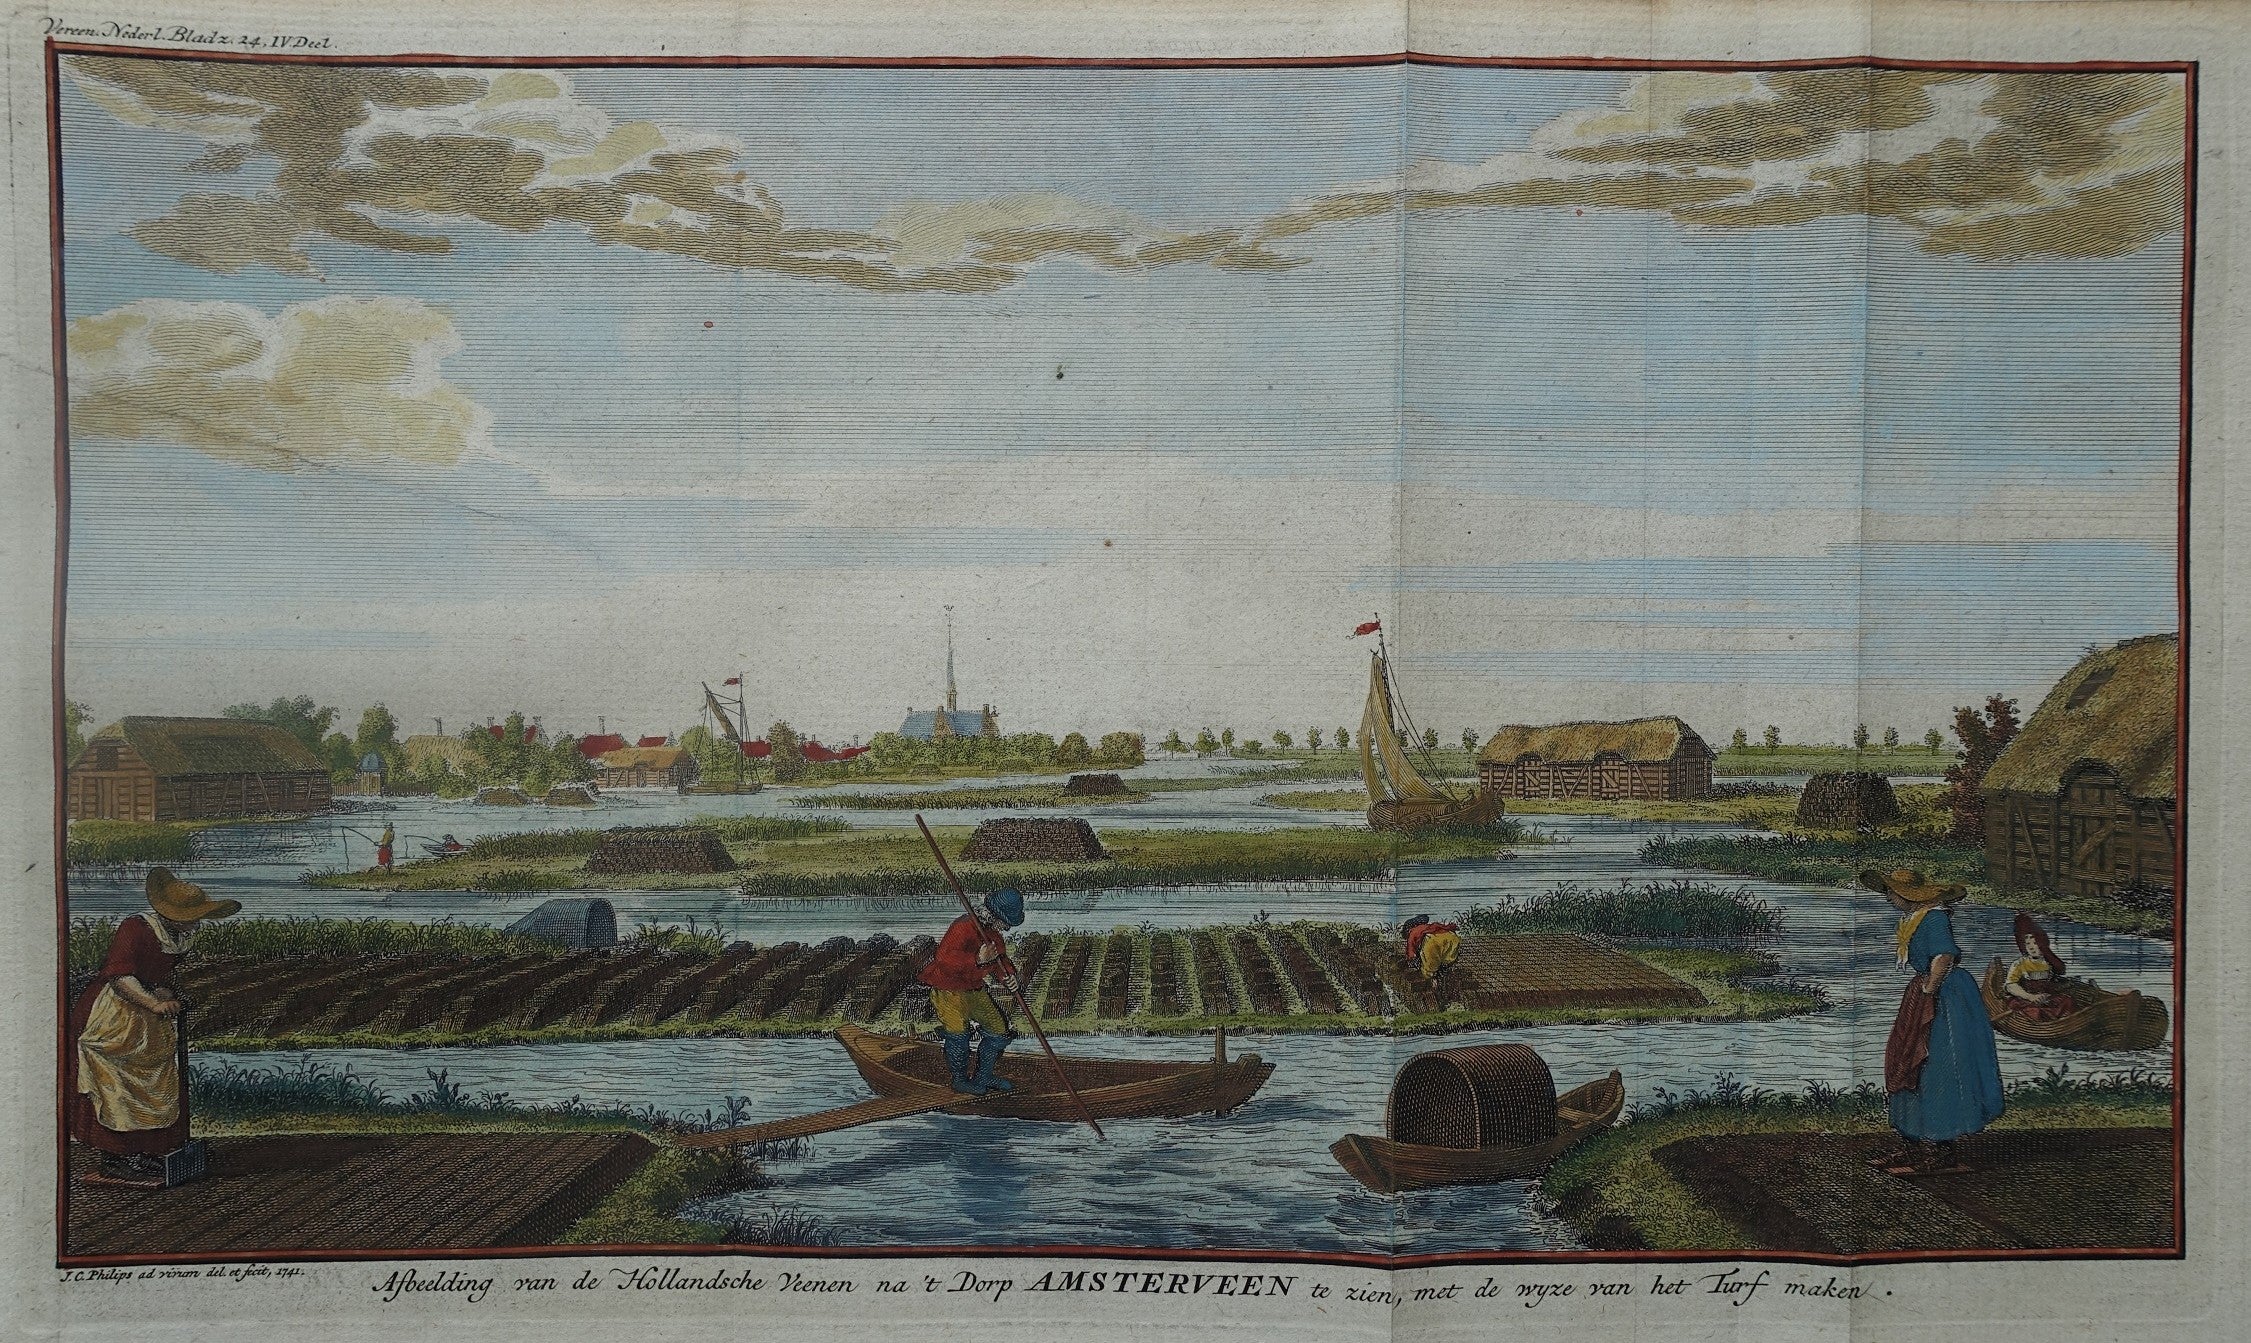
also e.g. in the holocene (peat))
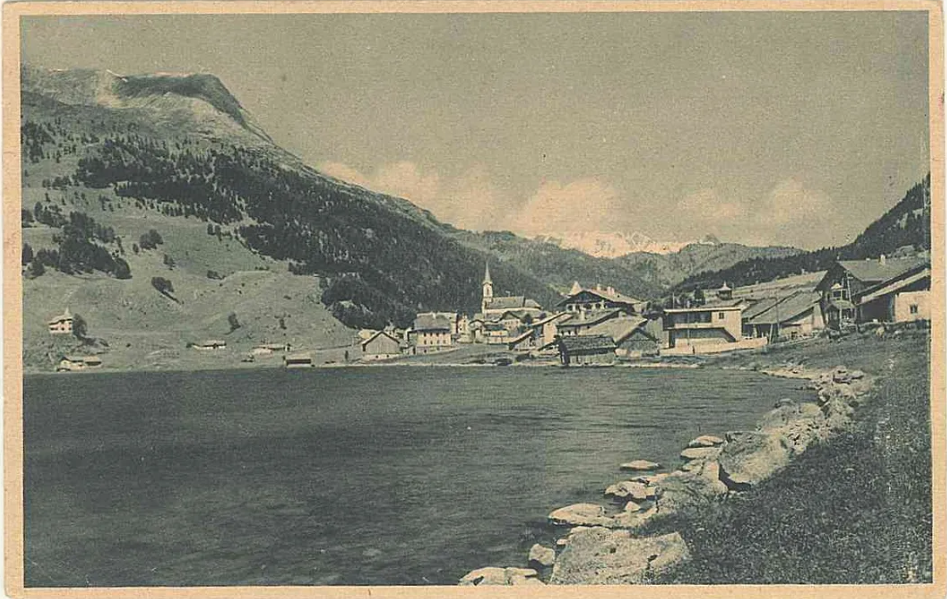
to their economic centres
landscape that unfolds in front of us
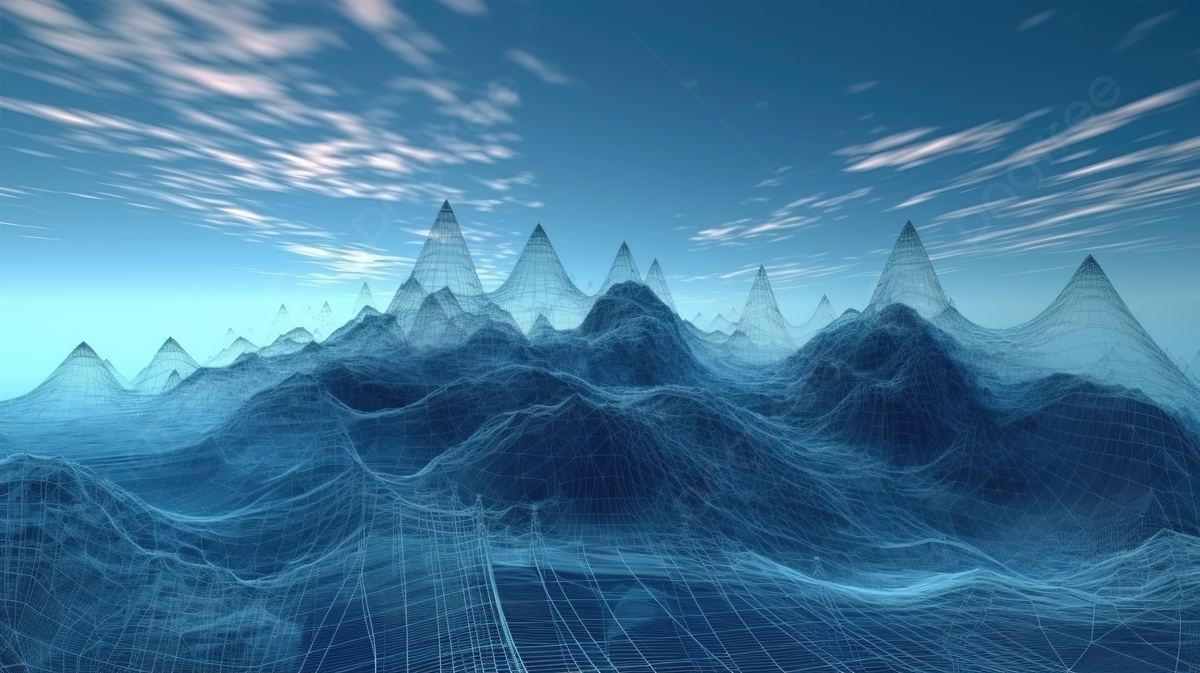
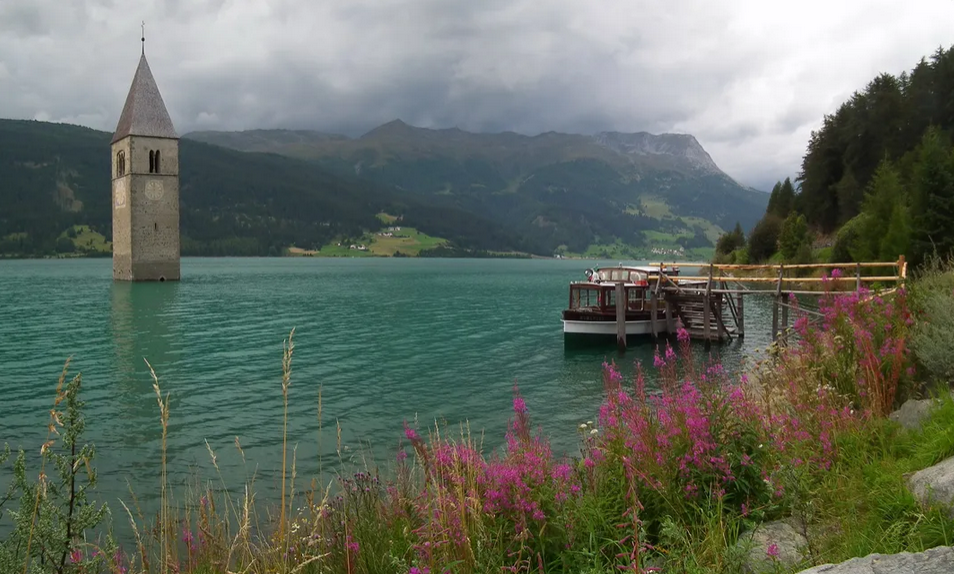
Steadily heading toward the abyss?
But something is happening…
But somethings is happening …
Next week: what forces are pushing this?
Today: what is happening?
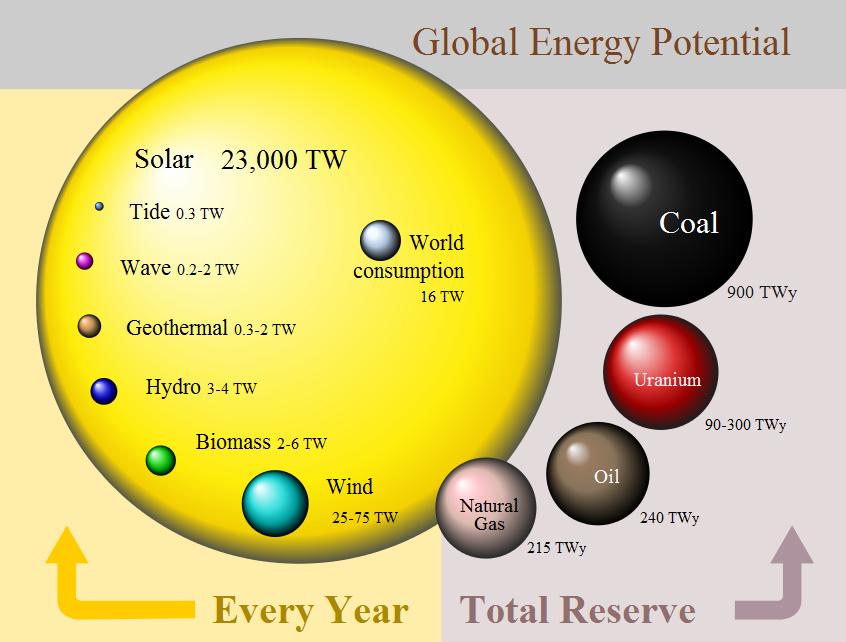
Getting a feel for energy units
Quantities vs flows
| Quantities | Flows |
|---|---|
| J | W (J/s) |
| kWh | kWh/year |
| k | kilo | 103 |
| M | mega | 106 |
| G | giga | 109 |
| T | tera | 1012 |
| P | peta | 1015 |
| E | exa | 1e18 |
kW

kWh in different economies
| 2018 | GDP/capita (USD) | Energy intensity (kWh/$) | Energy/capita (kWh/person) | Emission intensity (kg/$) | Emission intensity (kg/kWh) | Emissions/capita (kg/day) |
|---|---|---|---|---|---|---|
| United States | 61,356 | 1.48 | 80,583 | 0.29 | 0.20 | 44.4 |
| Netherlands | 56,061 | 1.25 | 59,348 | 0.19 | 0.19 | 25.2 |
| India | 6.436 | 1.03 | 6,634 | 0.29 | 0.29 | 5.2 |
| China | 15,134 | 2.12 | 27,109 | 0.57 | 0.57 | 20.0 |
MW
GW
TW
PW
Low carbon technologies
| 2018 | GDP/capita (USD) | Energy intensity (kWh/$) | Energy/capita (kWh/person) | Emission intensity (kg/$) | Emission intensity (kg/kWh) | Emissions/capita (kg/day) |
|---|---|---|---|---|---|---|
| United States | 61,356 | 1.48 | 80,583 | 0.29 | 0.20 | 44.4 |
| Netherlands | 56,061 | 1.25 | 59,348 | 0.19 | 0.19 | 25.2 |
| India | 6.436 | 1.03 | 6,634 | 0.29 | 0.29 | 5.2 |
| China | 15,134 | 2.12 | 27,109 | 0.57 | 0.57 | 20.0 |
Low carbon technologies
Coal to gas
CCS
Nuclear
Wind
Solar
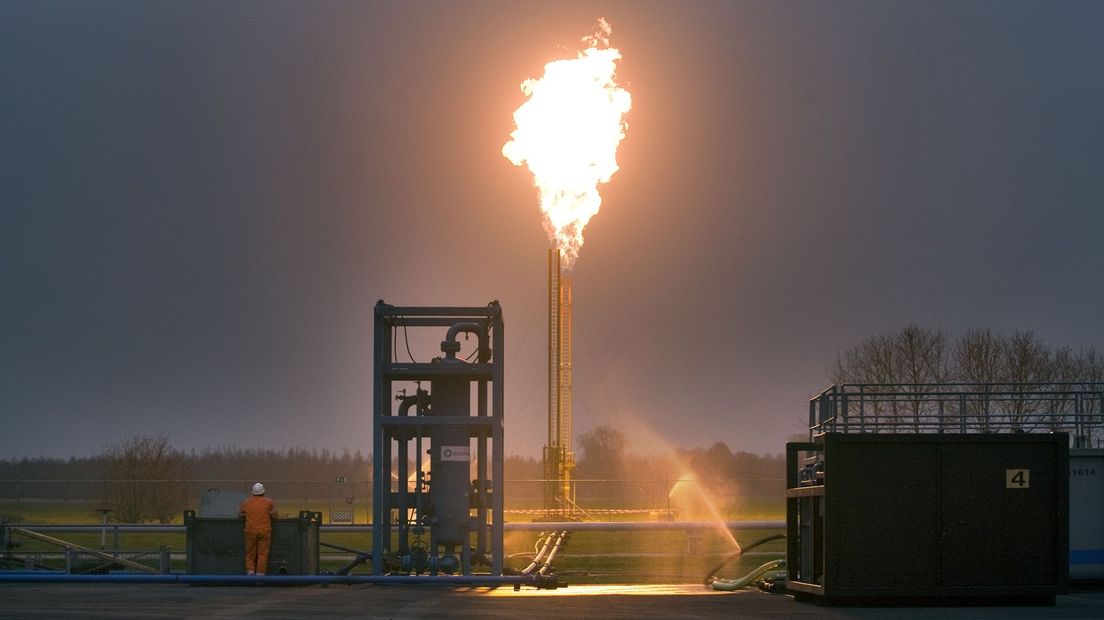
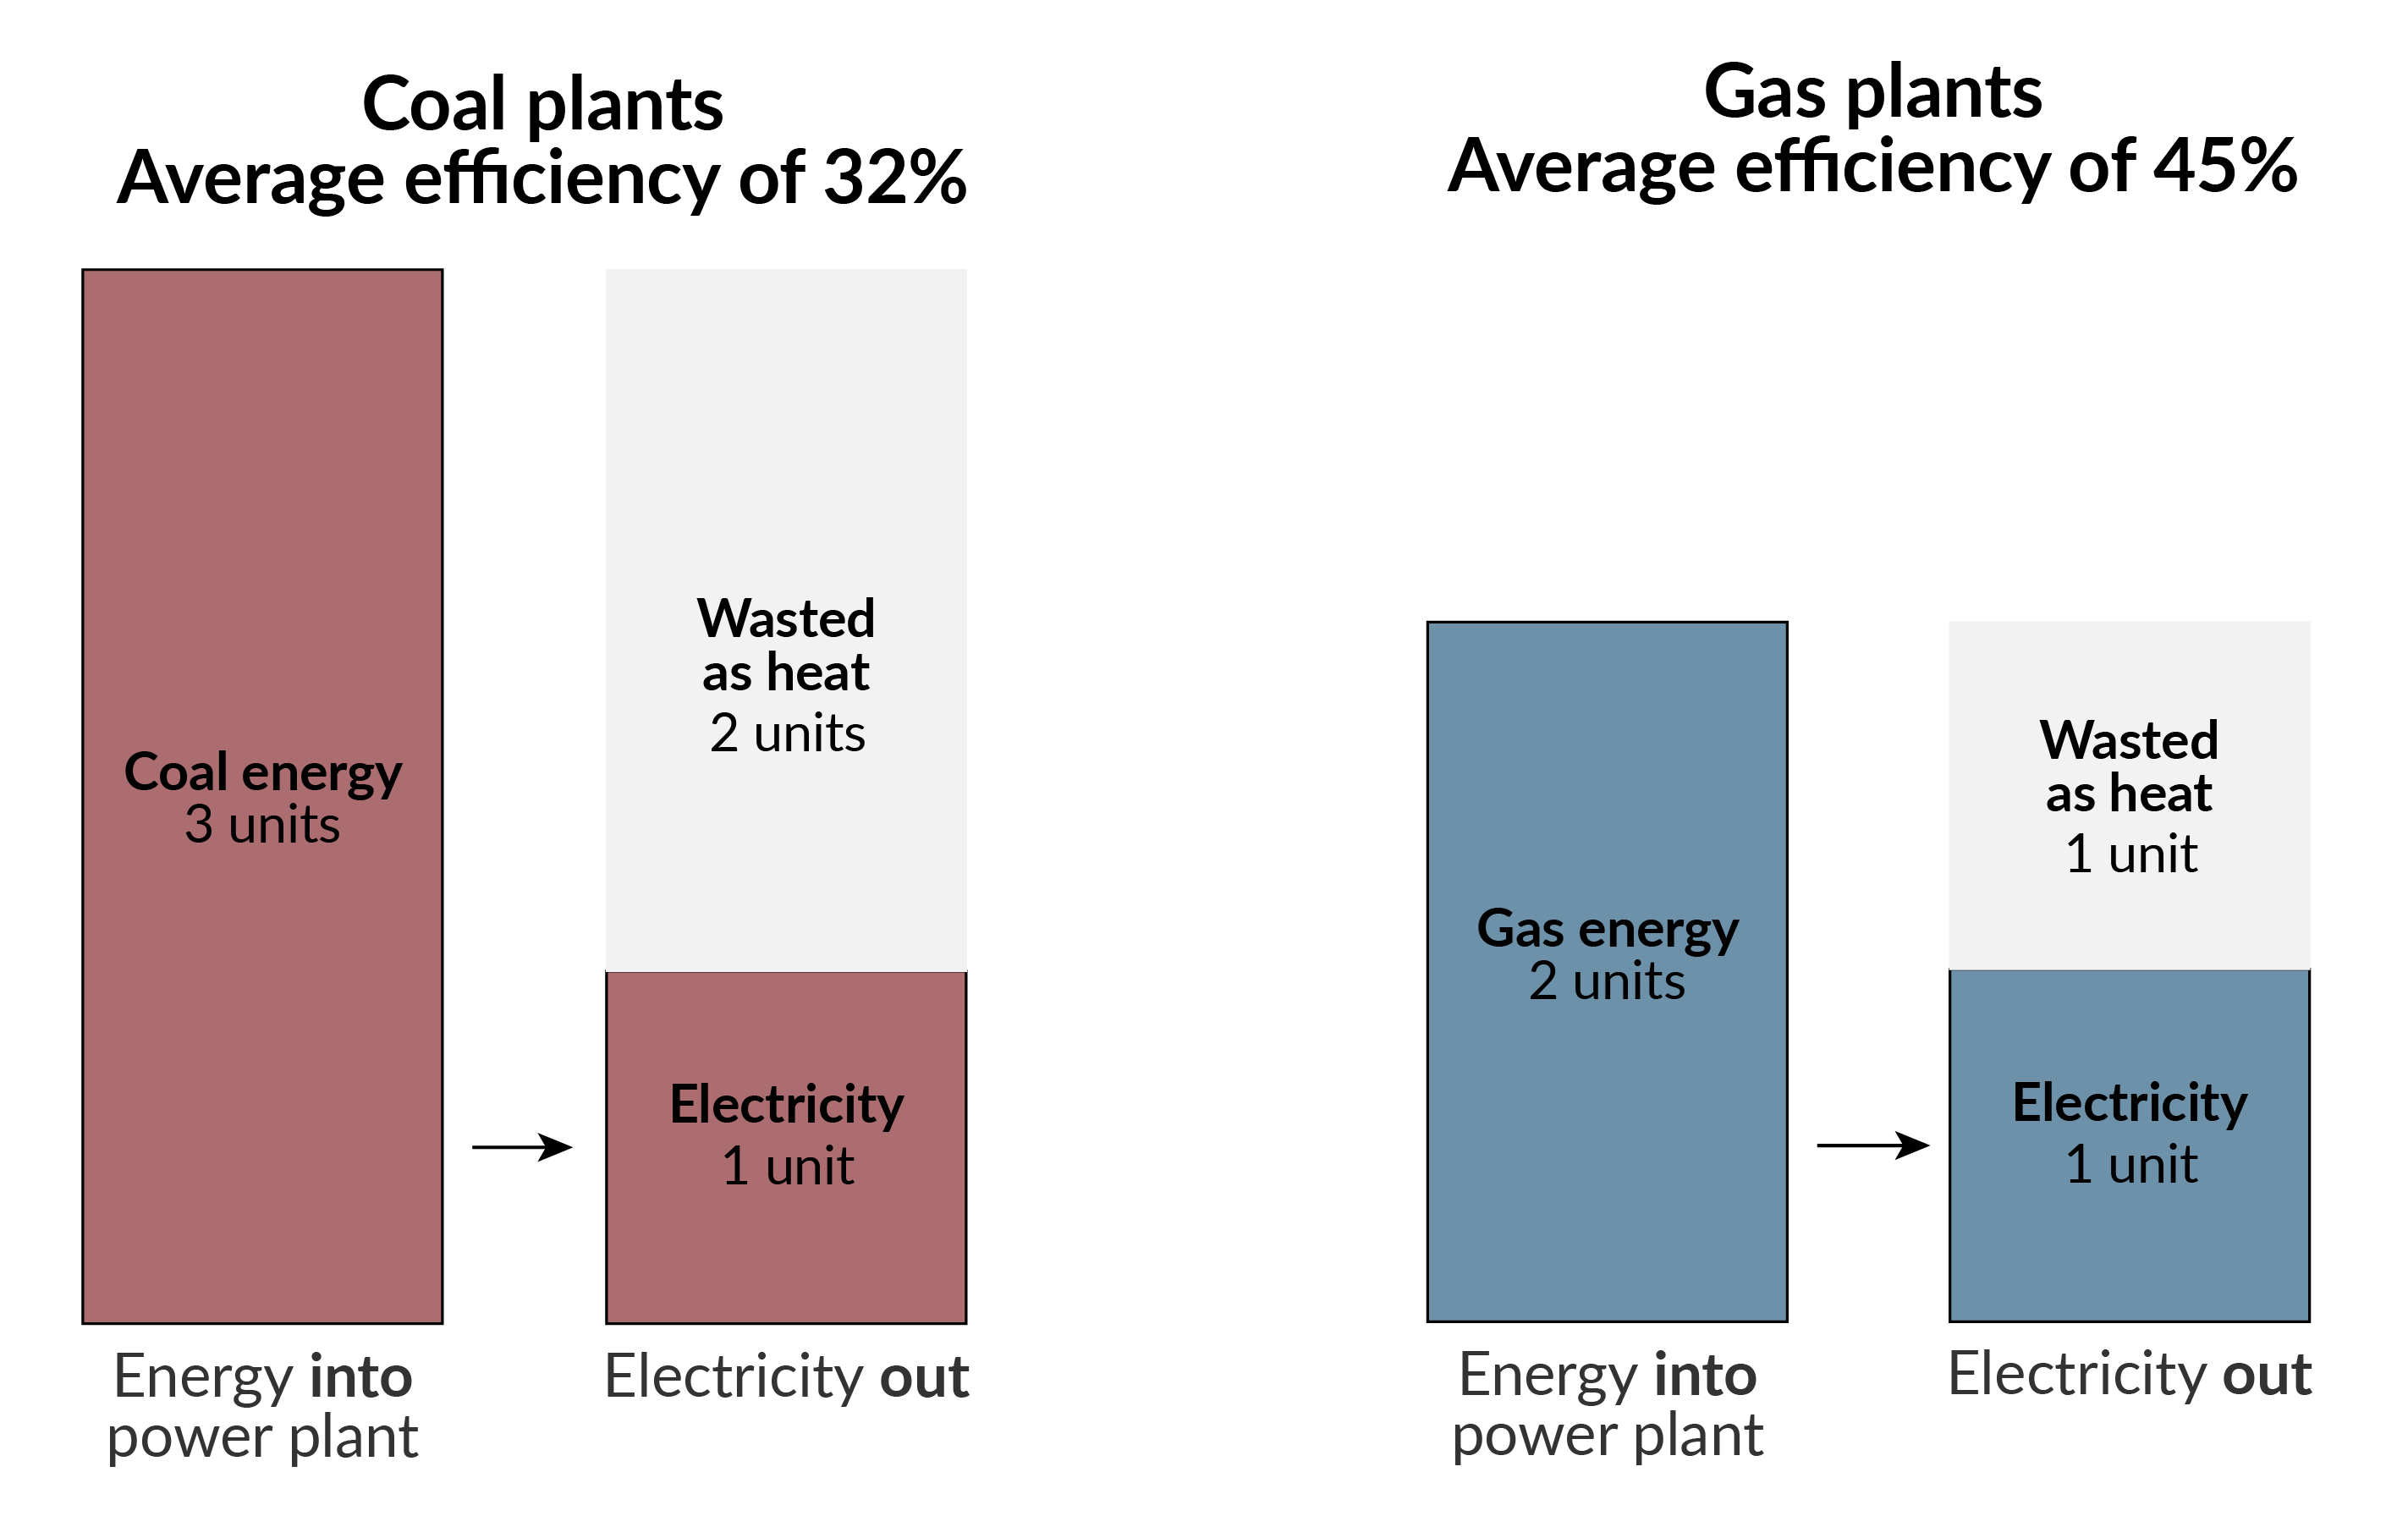
Coal to gas
Coal to gas
Coal to gas
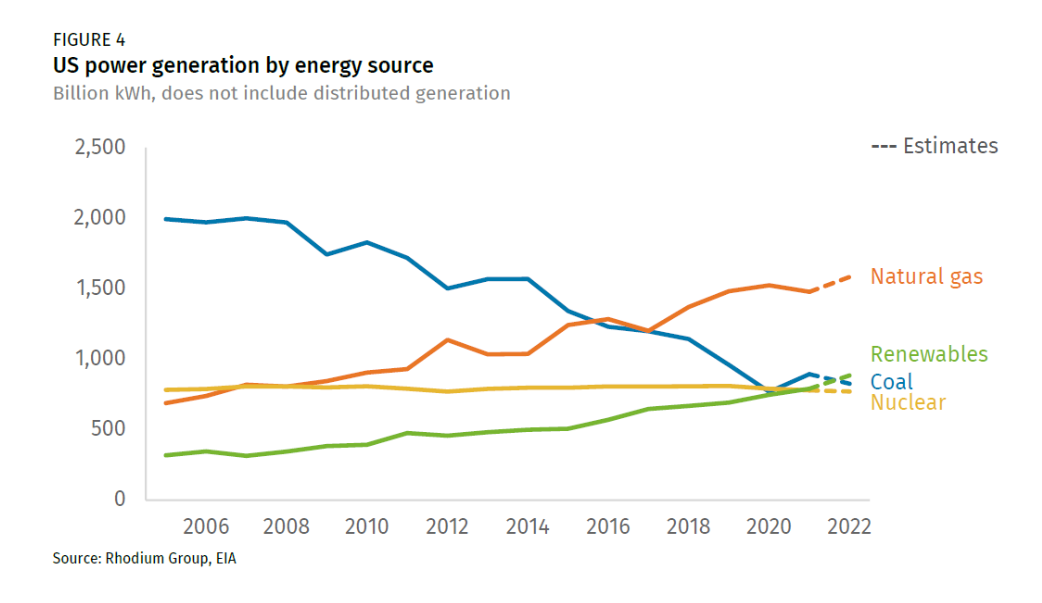
Coal to gas
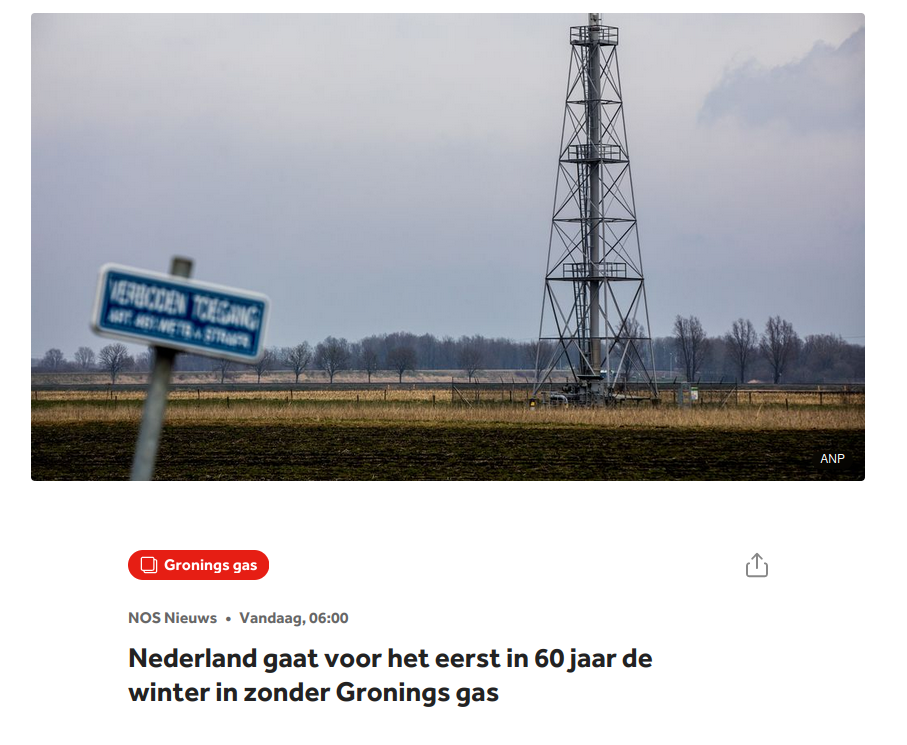
Aardgas paradox

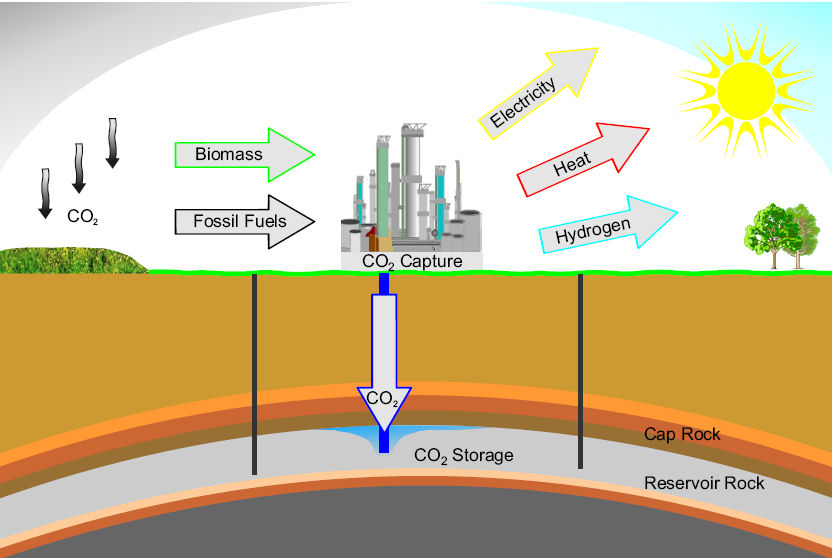
Carbon capture and storage (CCS)
Carbon capture and storage
Bioenergy with carbon capture and storage
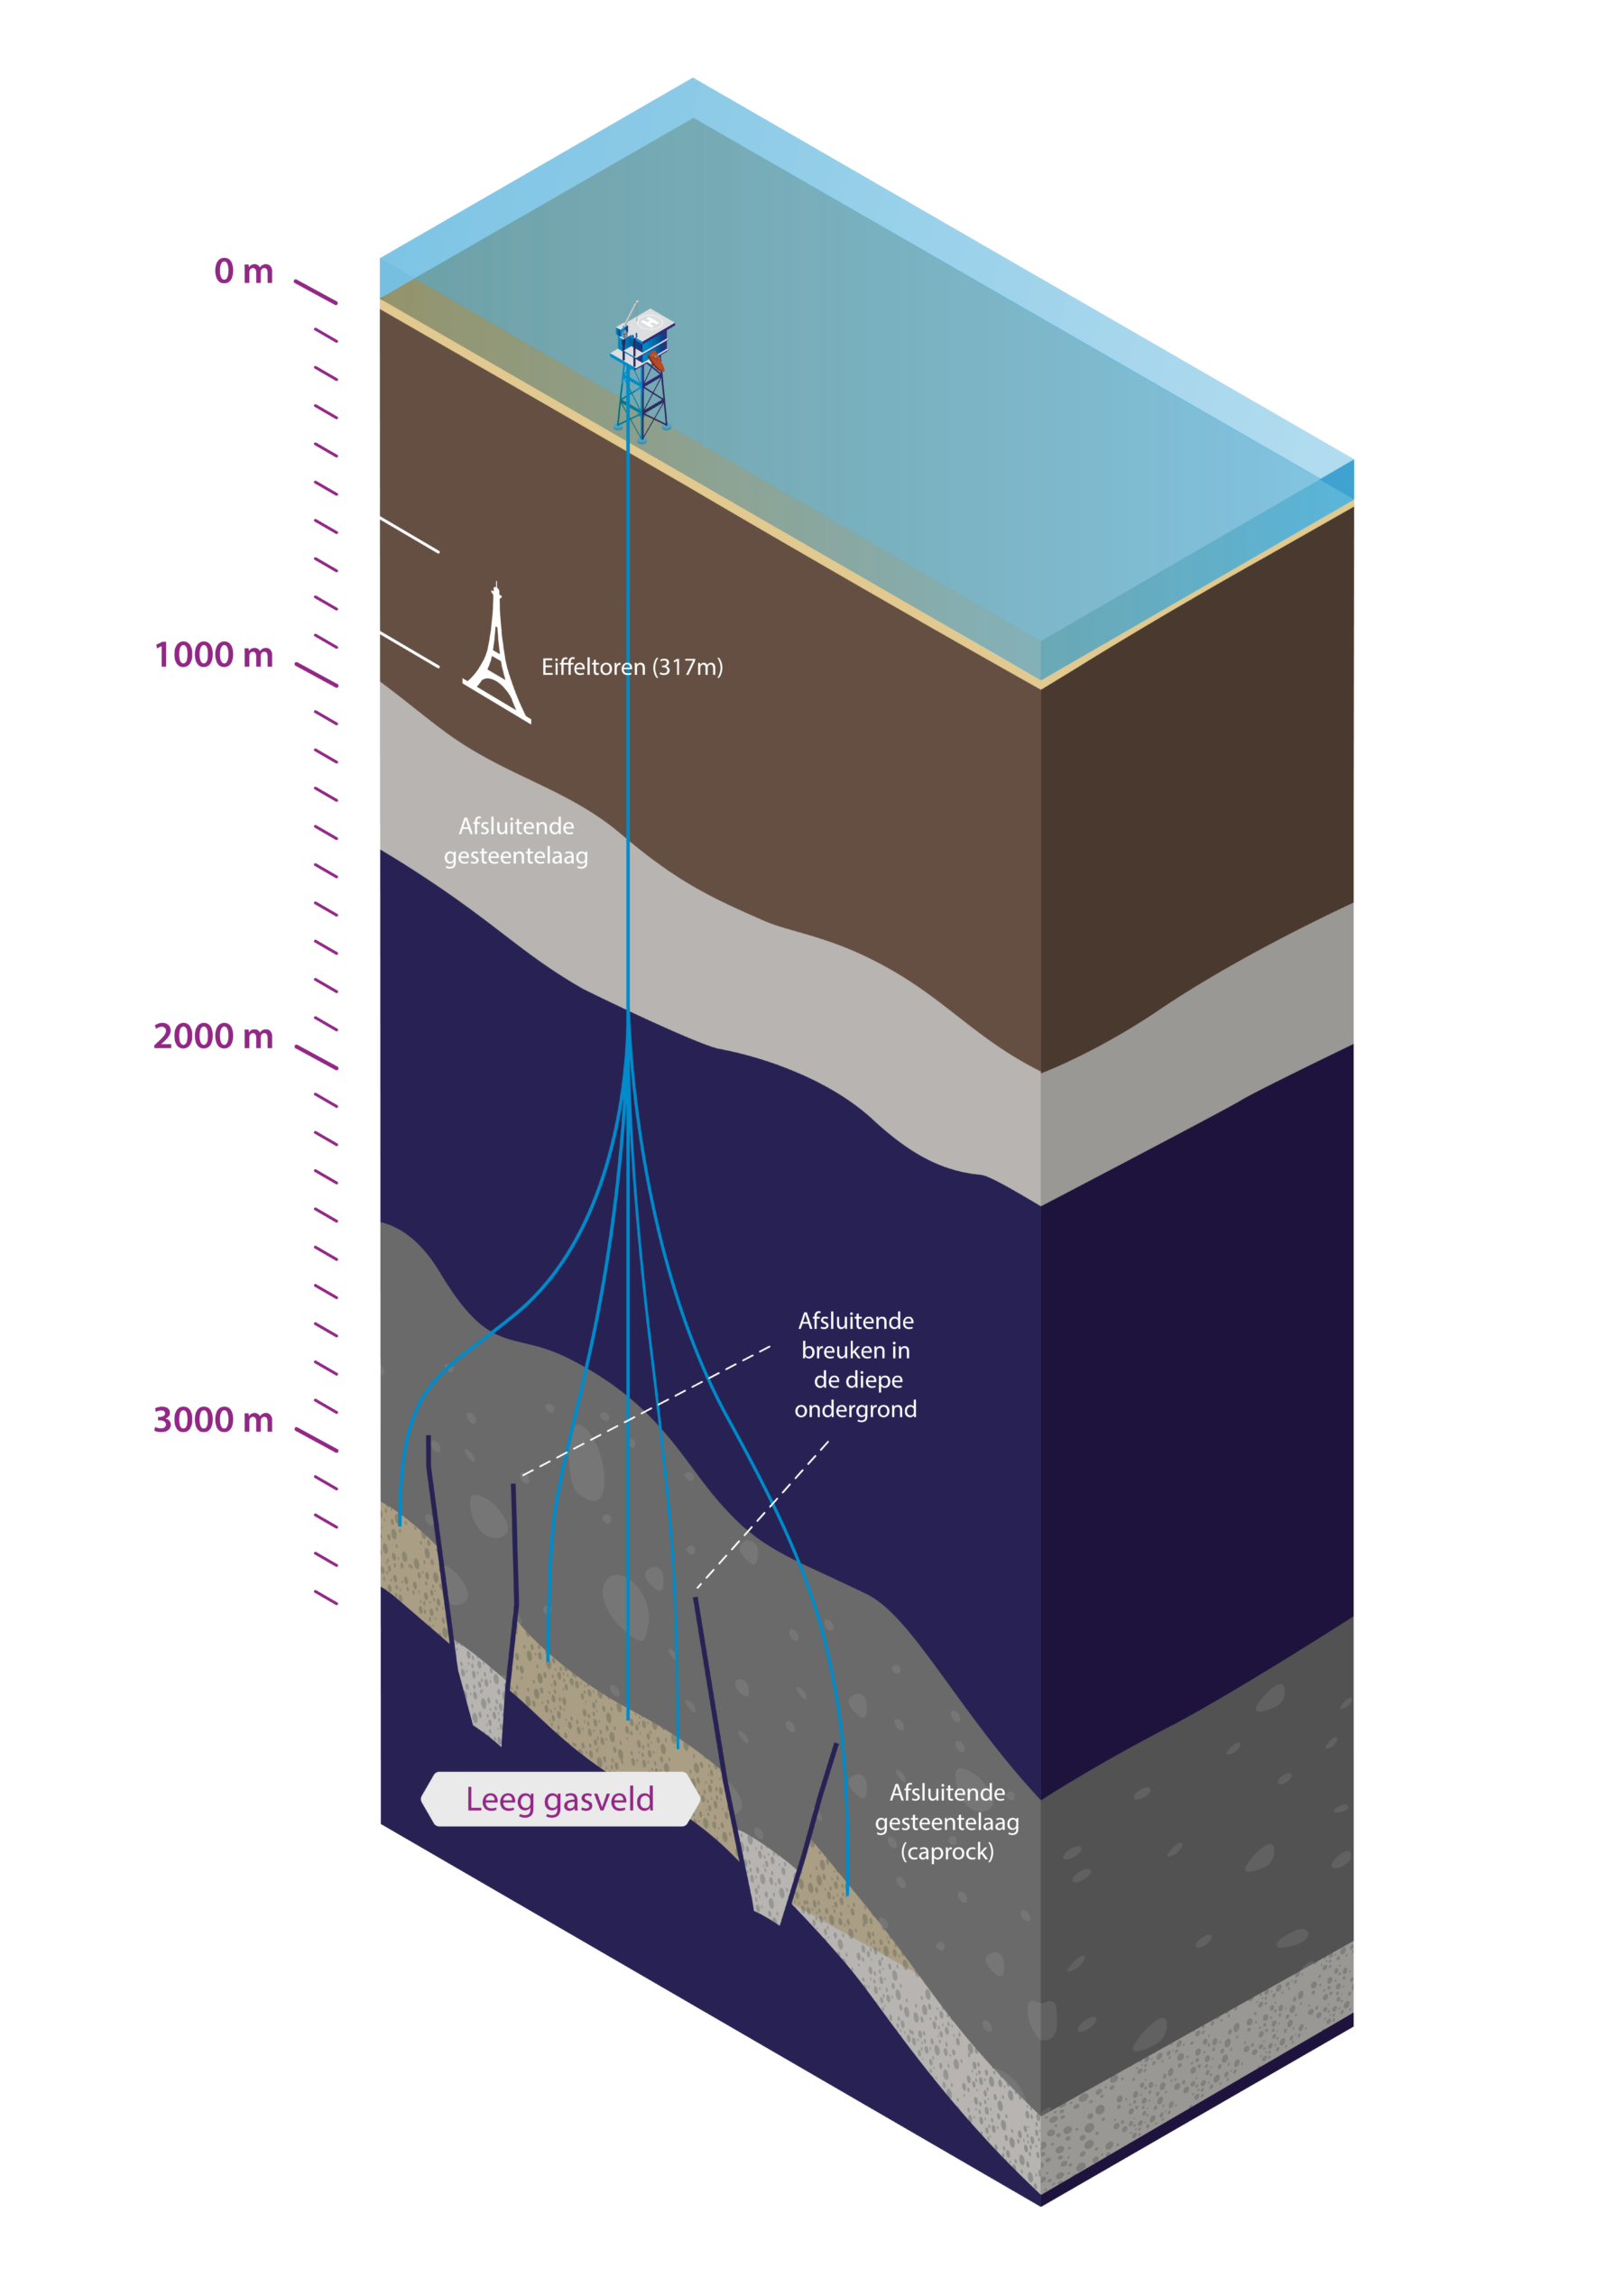
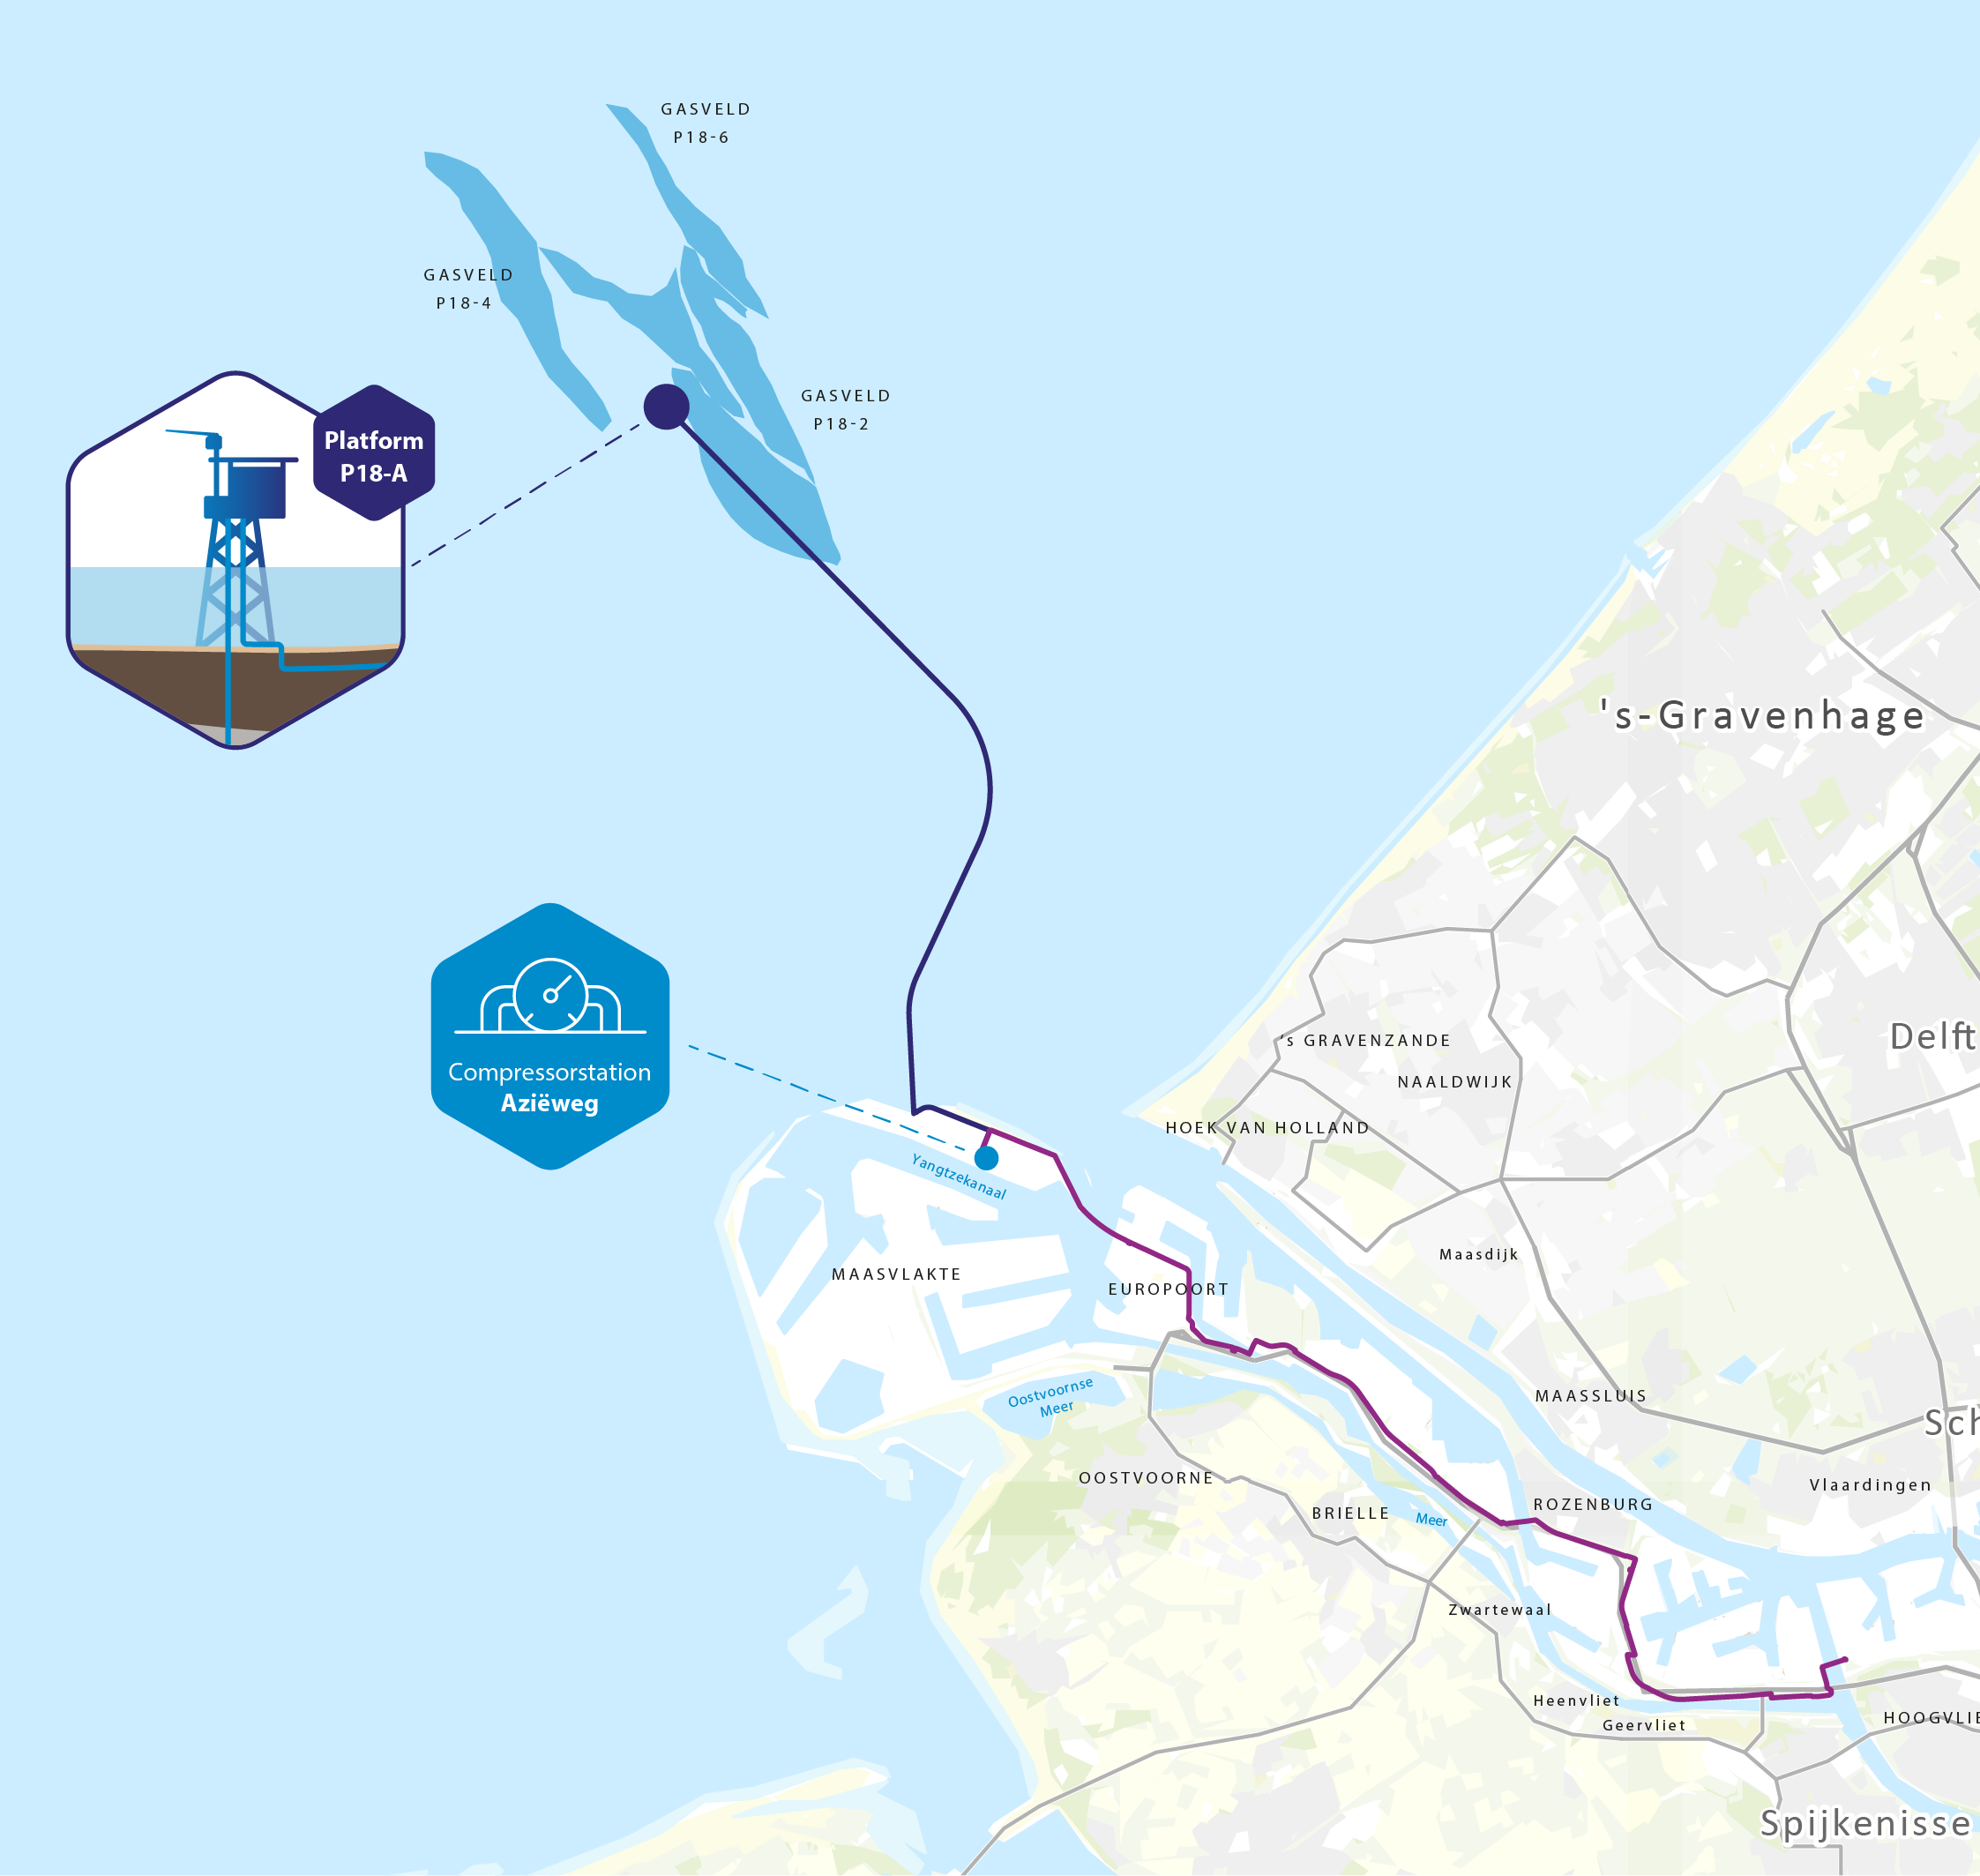
Porthos CO2 transport and storage
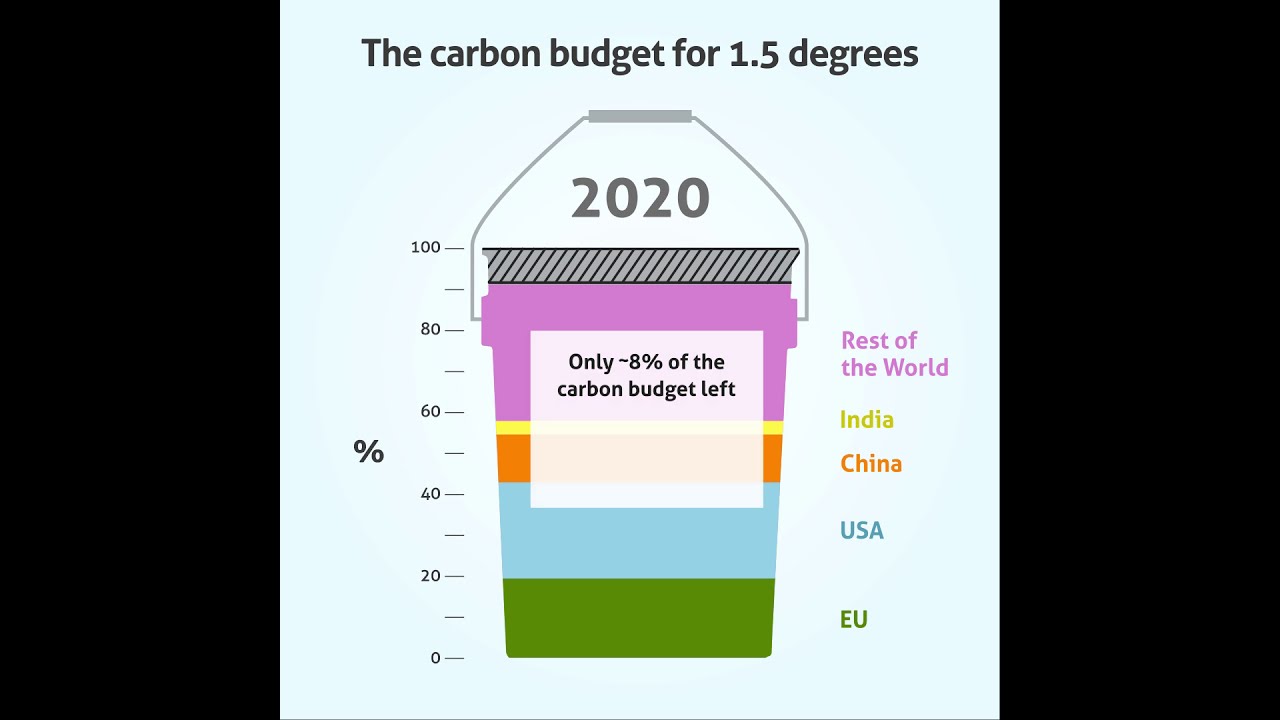
But careful: this does not include land-use change!
Carbon capture and storage
Storage options near point of emission?
Perpetuation of fossil fuel ecosystem?
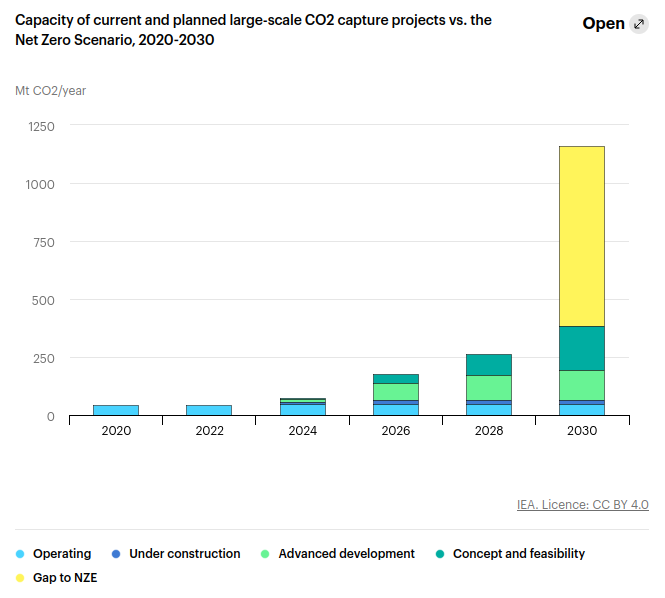
Current and projected global capacity
Nuclear
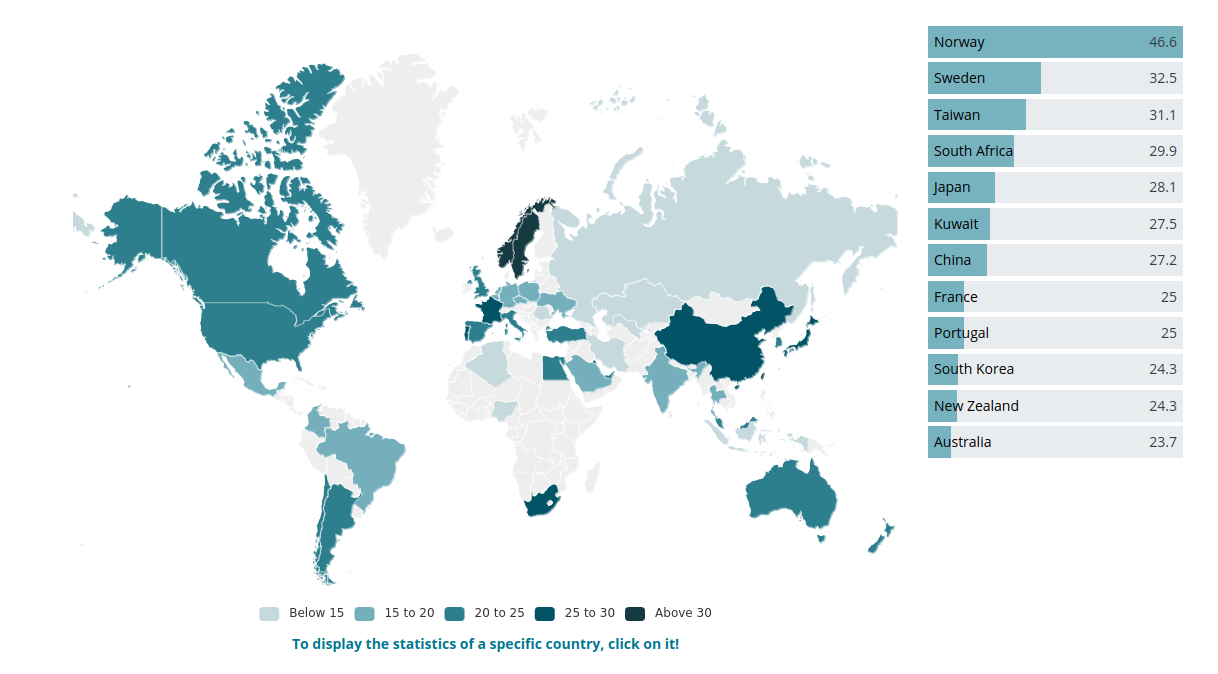
Global share + trend
Nuclear: global distribution share + trend
Pros and cons
Proven technology
Provision of baseload electricity
Costs (time and money)
Risks (operational and proliferation)
Kurzgesagt (In a nutshell)
To watch later.
Renewables
Electrification
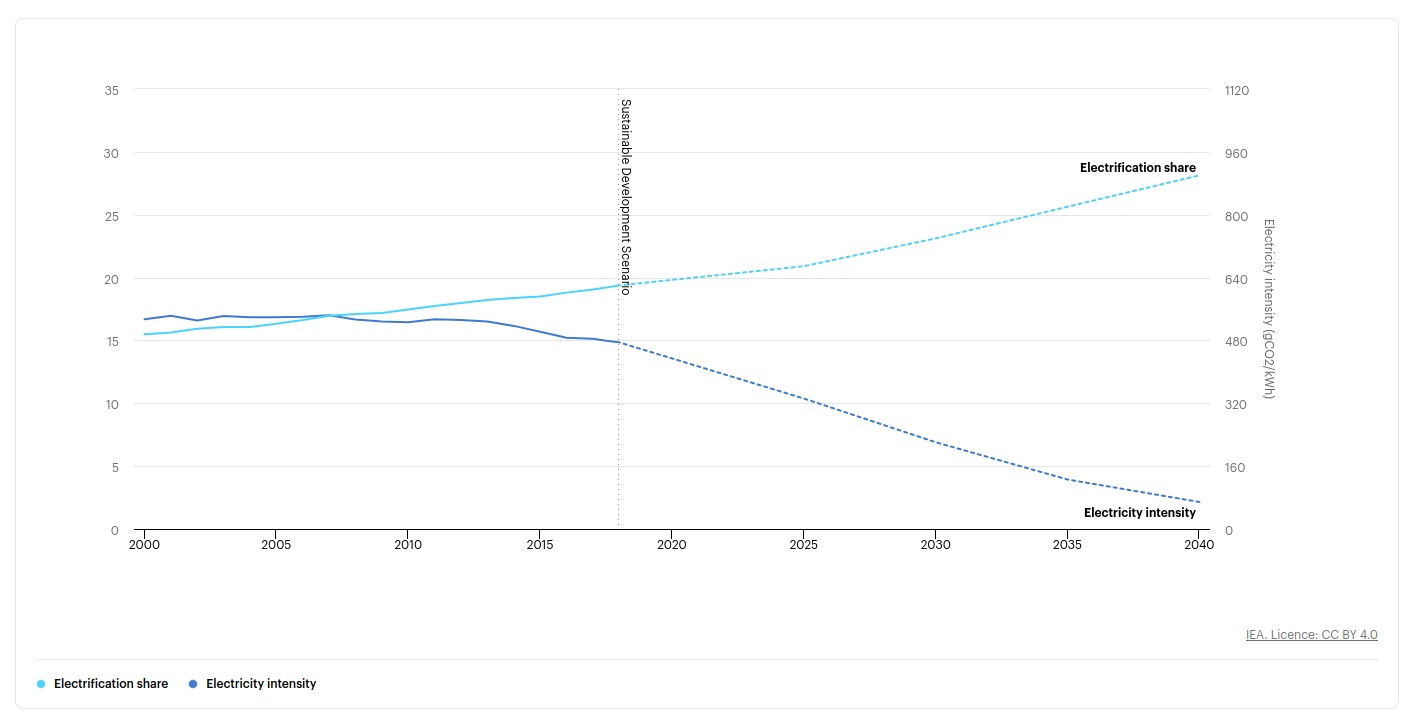
Share of electricity in total final energy consumption
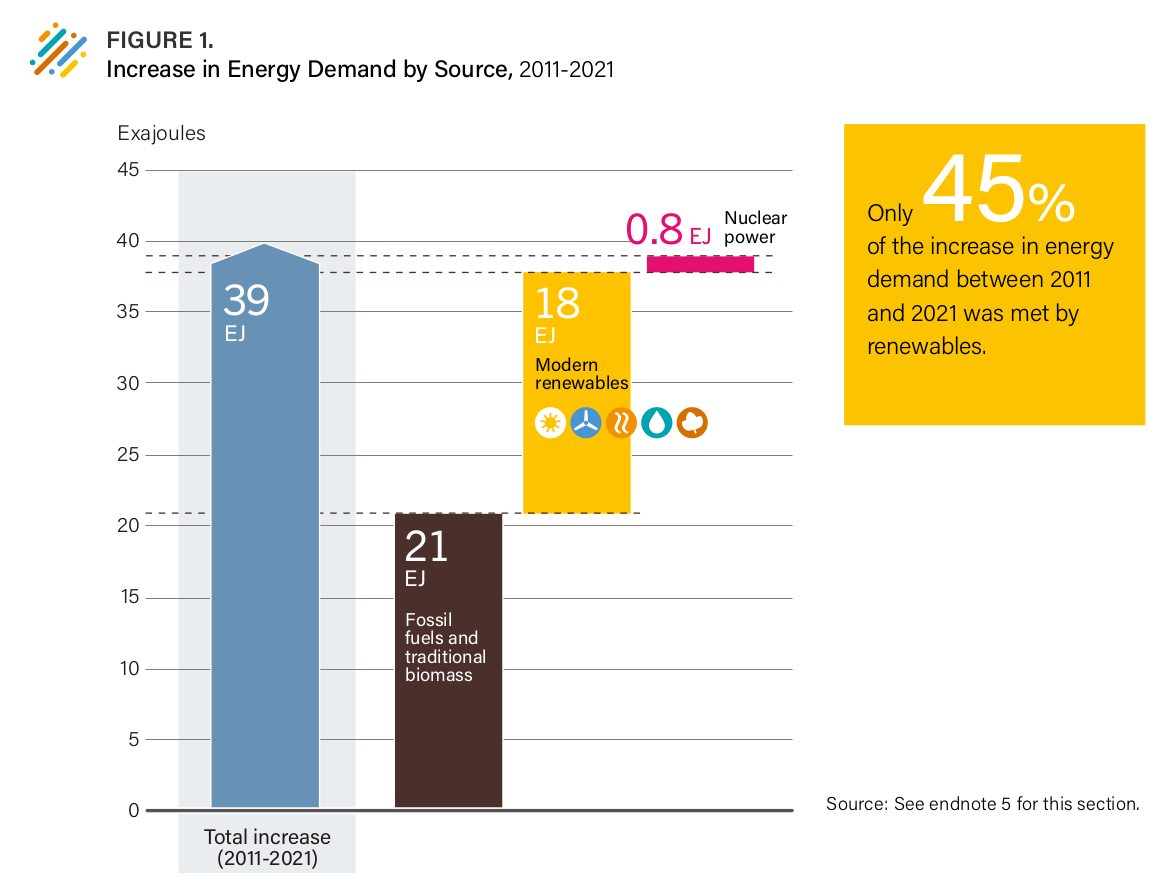
Most of new electricity is green…
"Renewables are set to account for over 90% of global electricity capacity expansion over the forecast period."
But most of new energy is not
Capacity factor
Substitution method
Substitution method
Wind
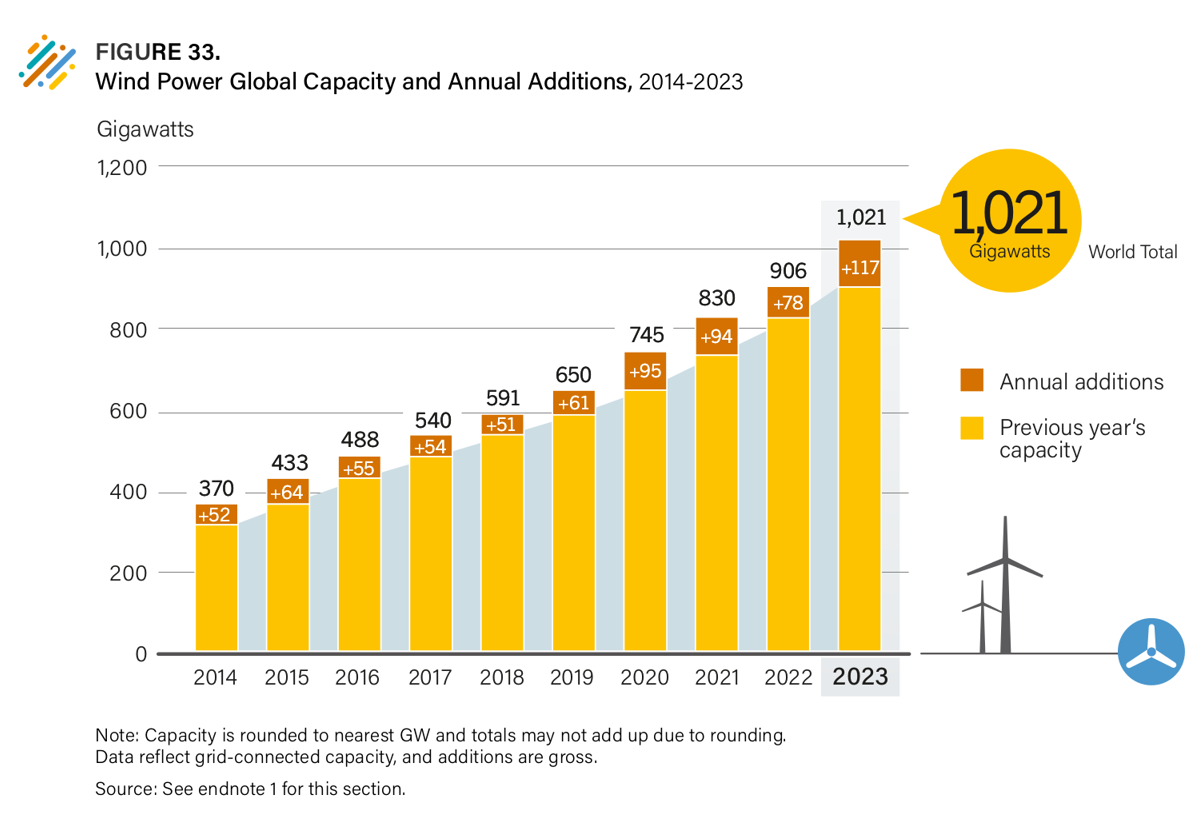
Wind power capacity trend
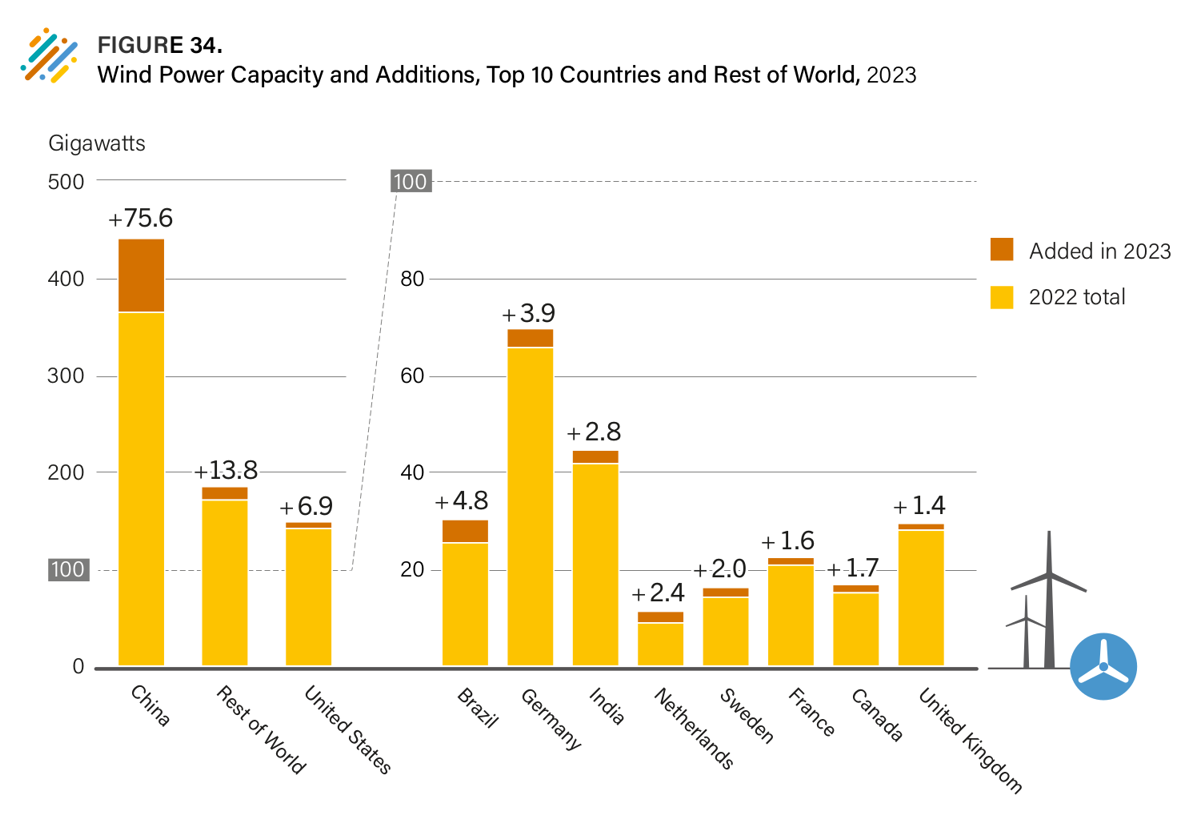
Wind power capacity trend per country
Global share + trend
Wind: global distribution share + trend
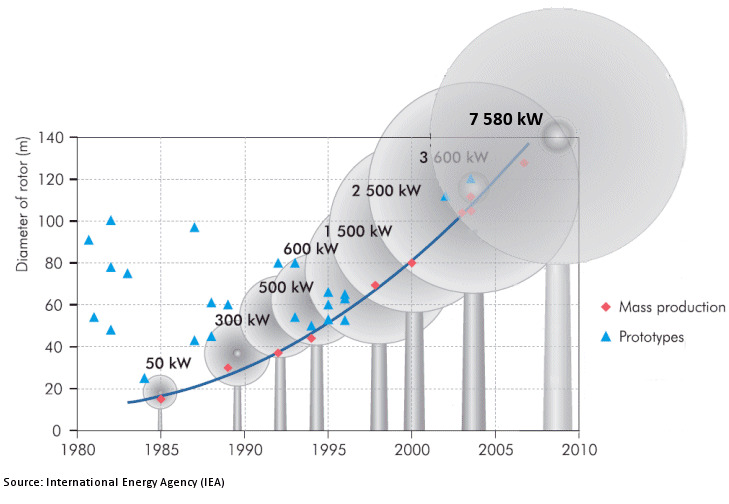
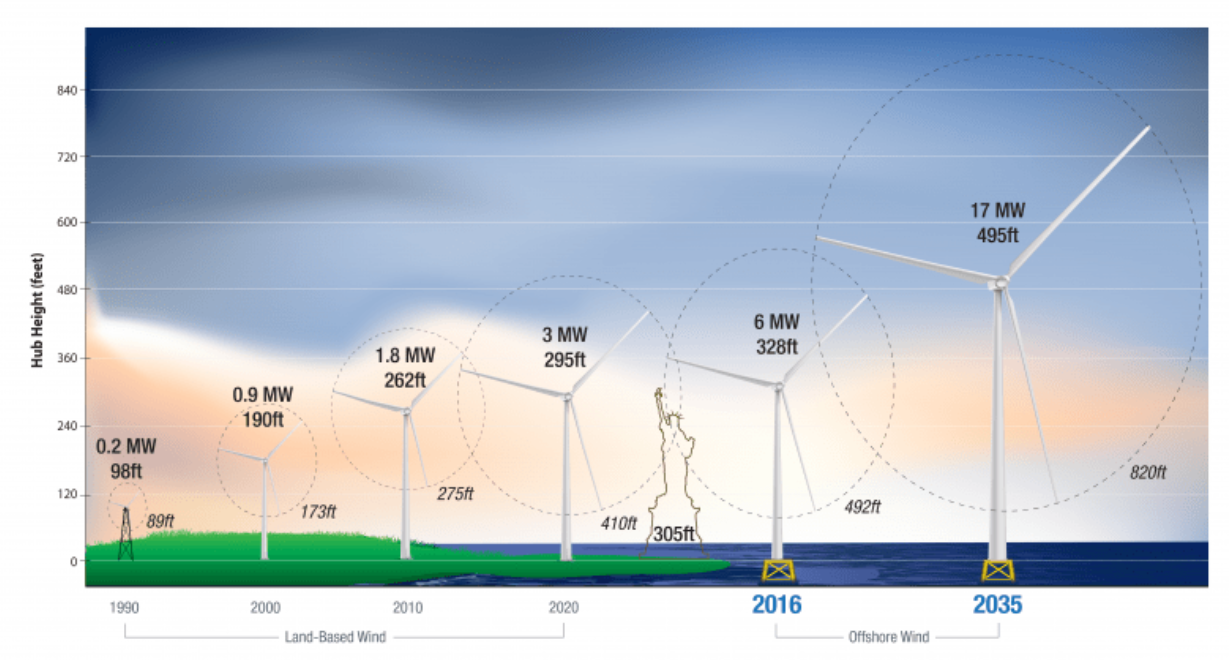
Wind turbine development
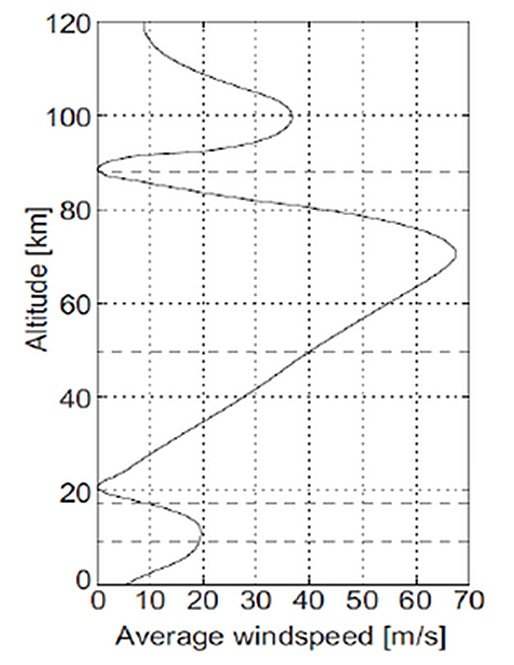
The power of the wind
\[P_{wind} = 0.5 \rho v^3\]
| P | power (W) |
| ρ | density of air (kg/m3) |
| v | wind velocity (m/s) |
Capturing the power of the wind: altitude
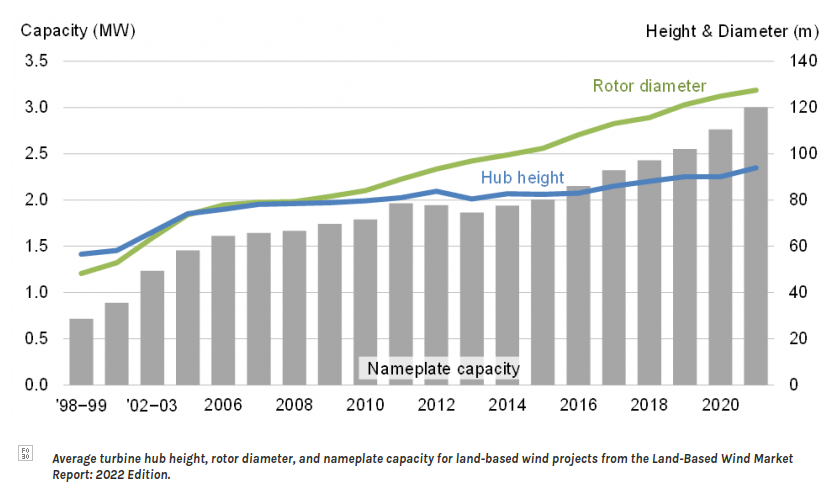
Capturing the power of the wind: blade size
\[P_{turbine} = \nu A P_{wind}\]
| ν | turbine efficiency |
| A | wind mill area perpendicular to the wind |
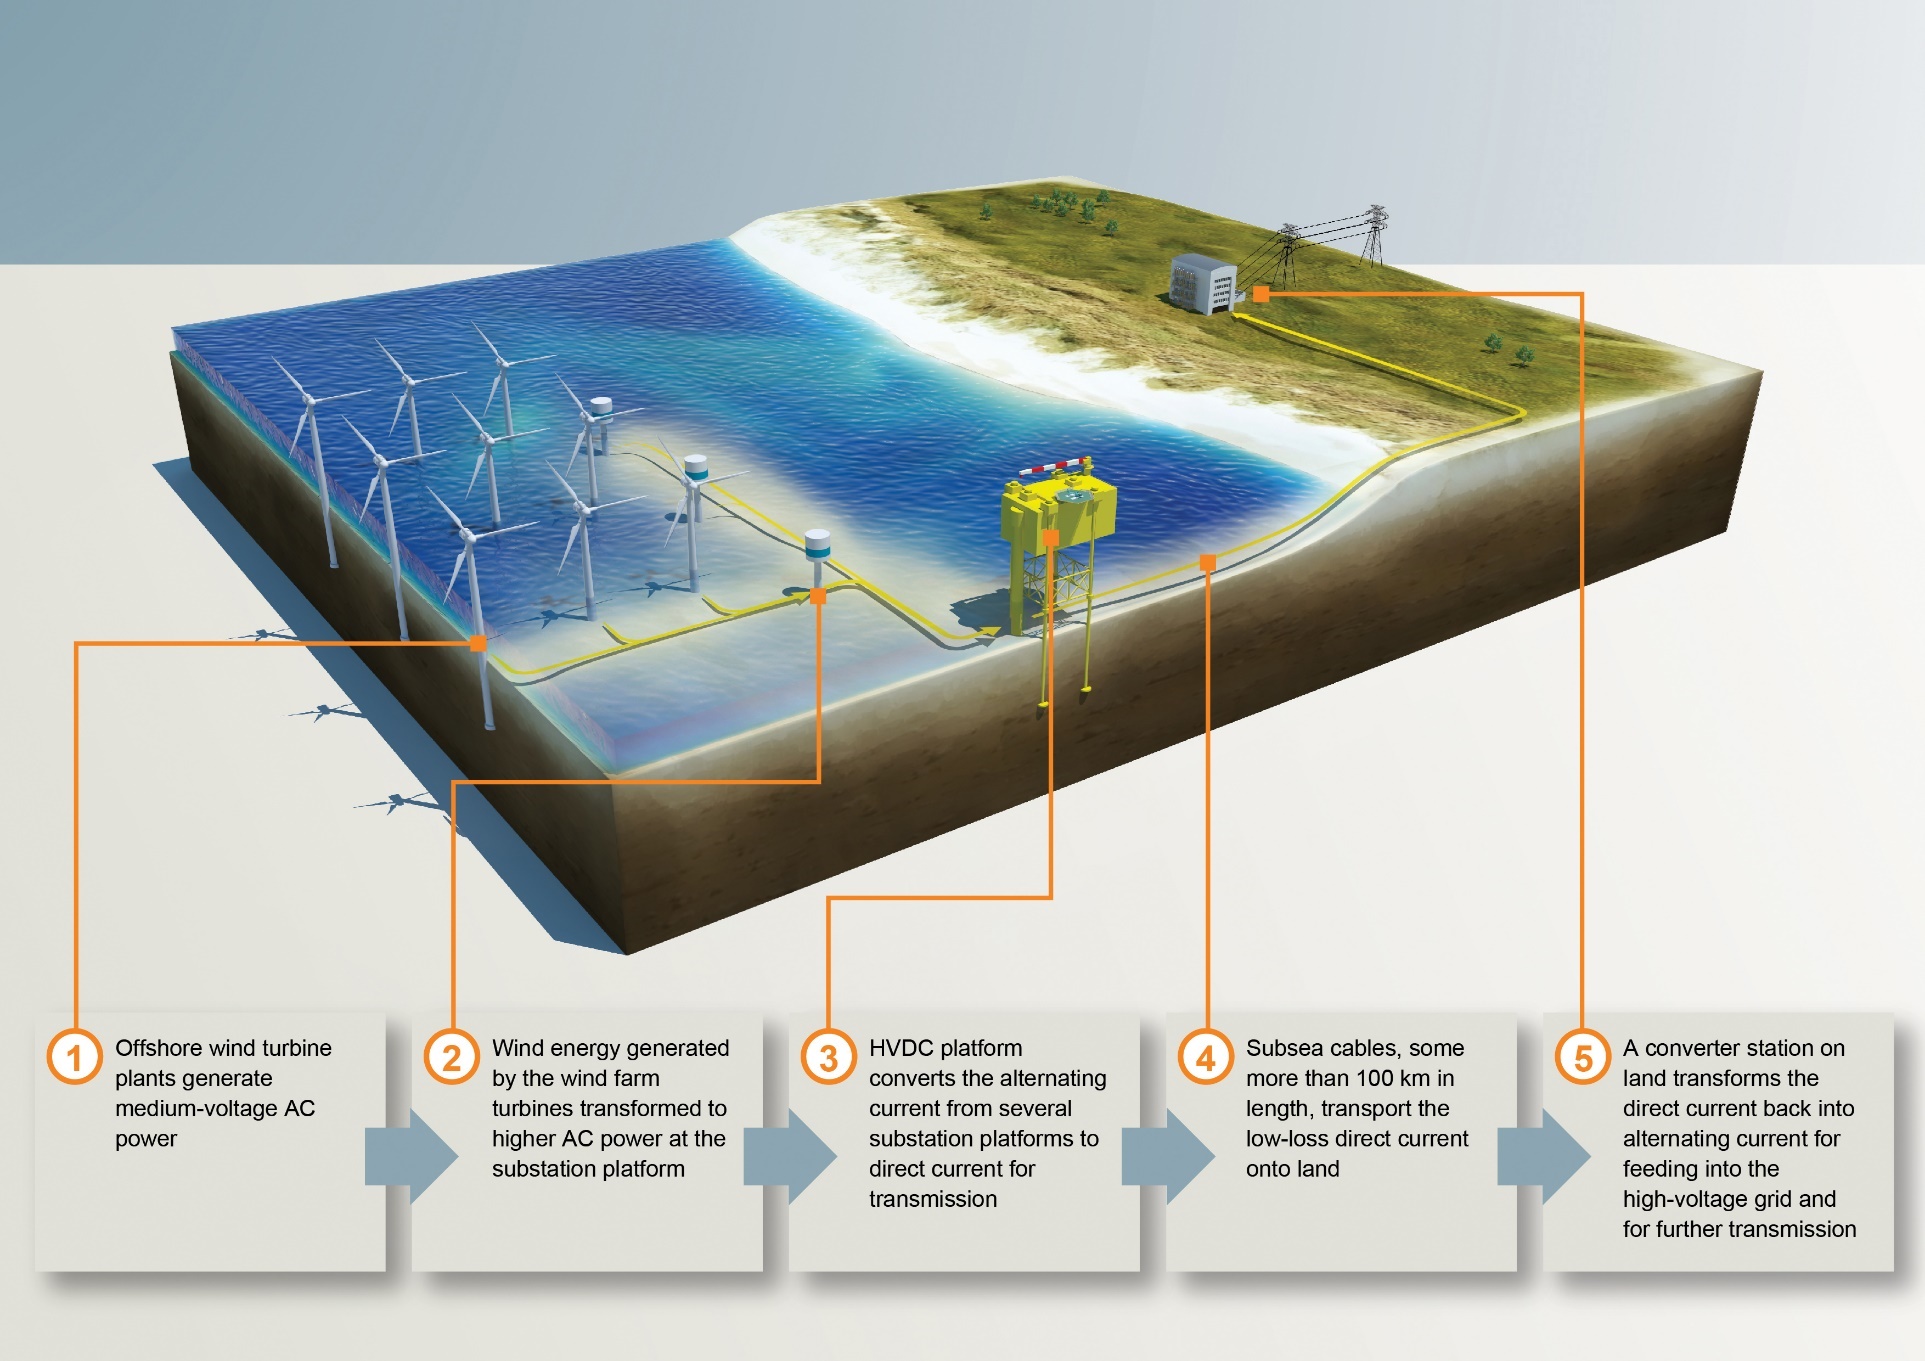
Capturing the power of the wind: at sea
Turbine trends
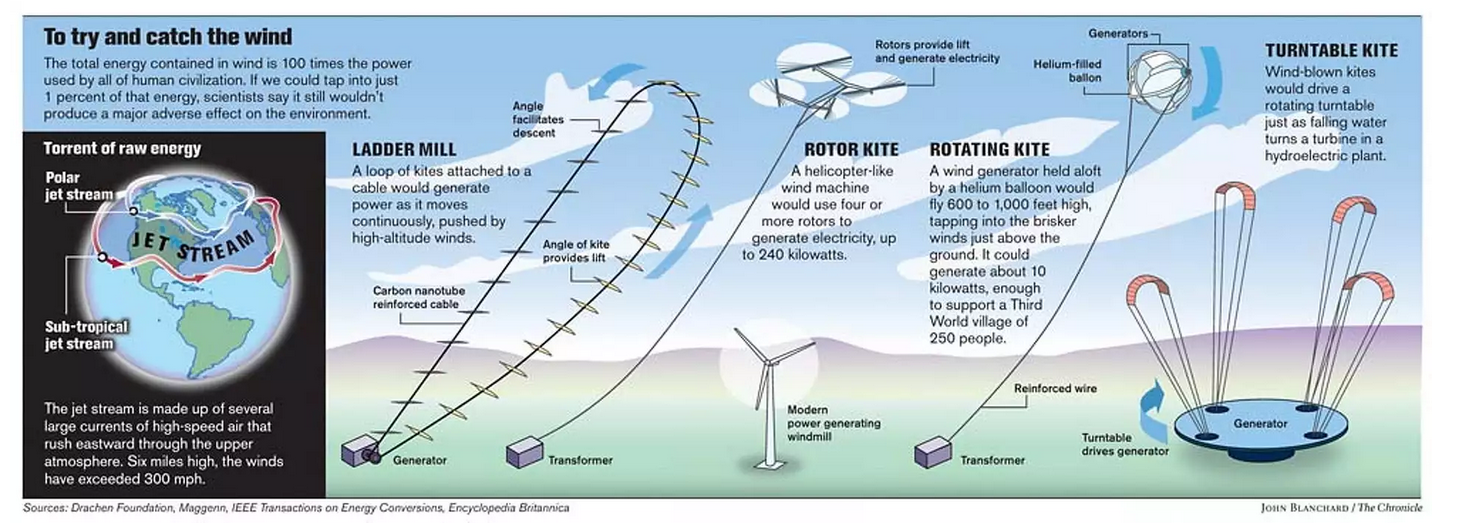
Capturing the wind: far future?
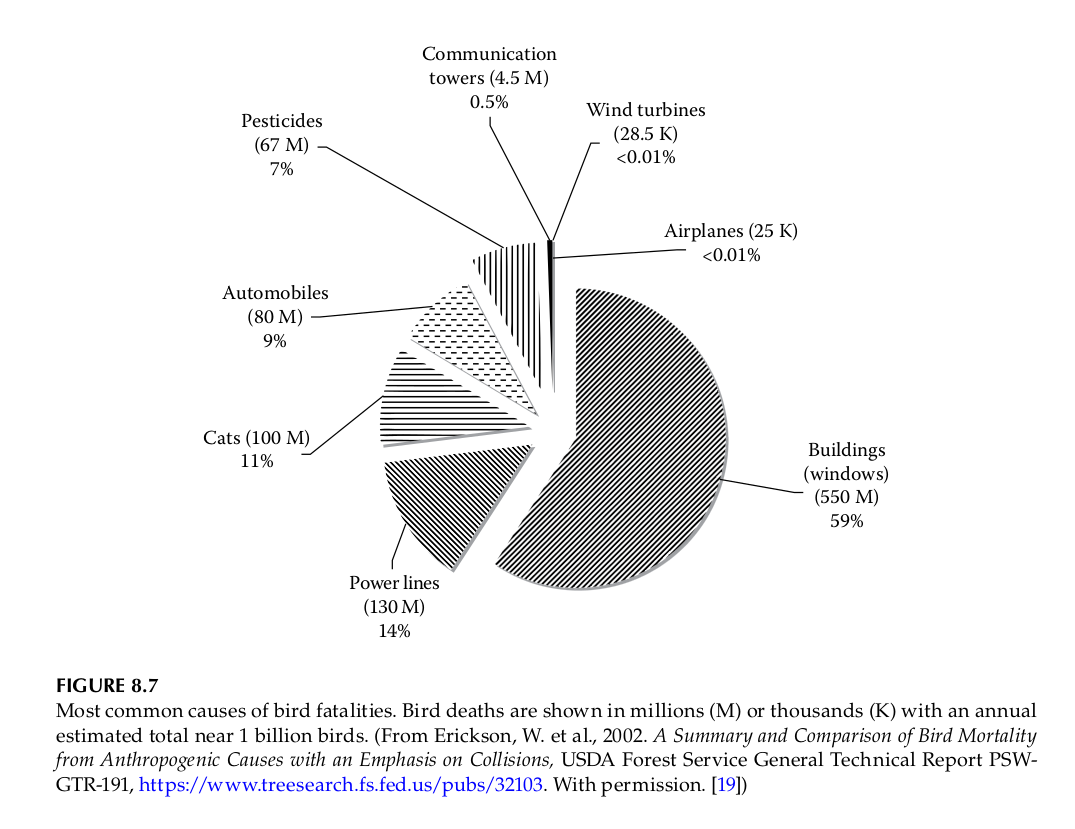
Bird fatalities
Costs
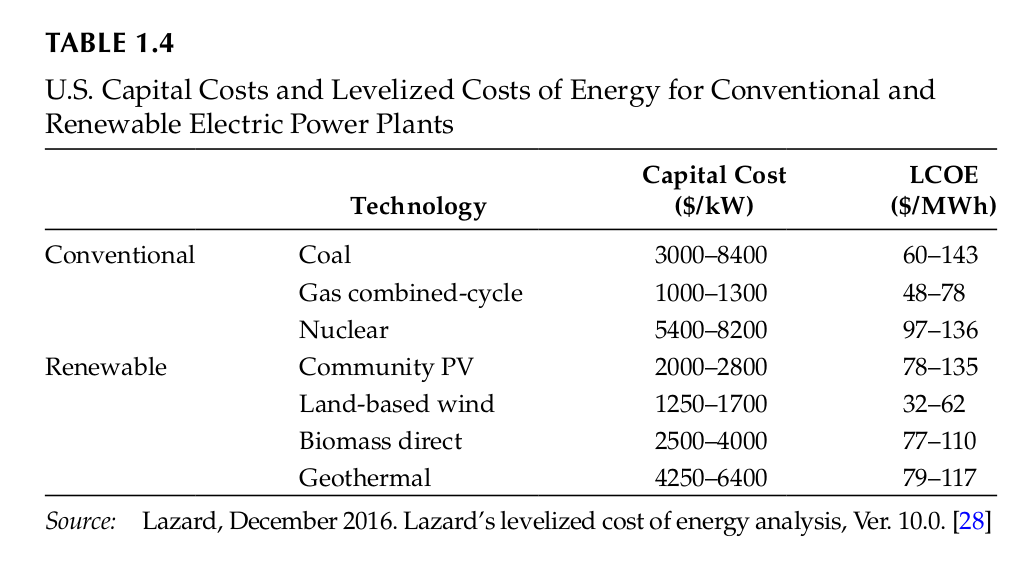
Costs
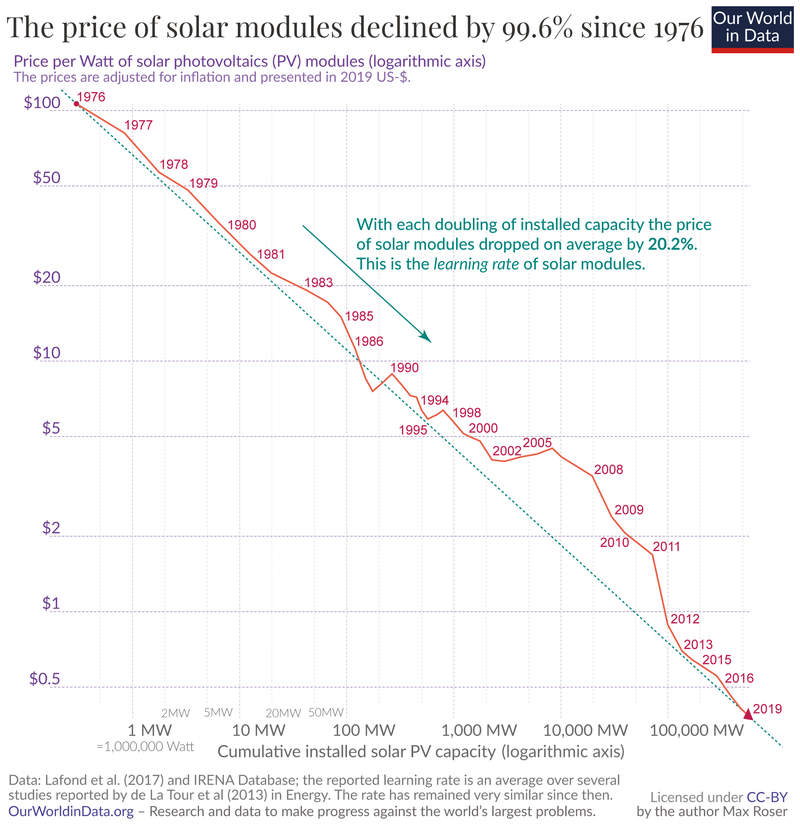
Solar
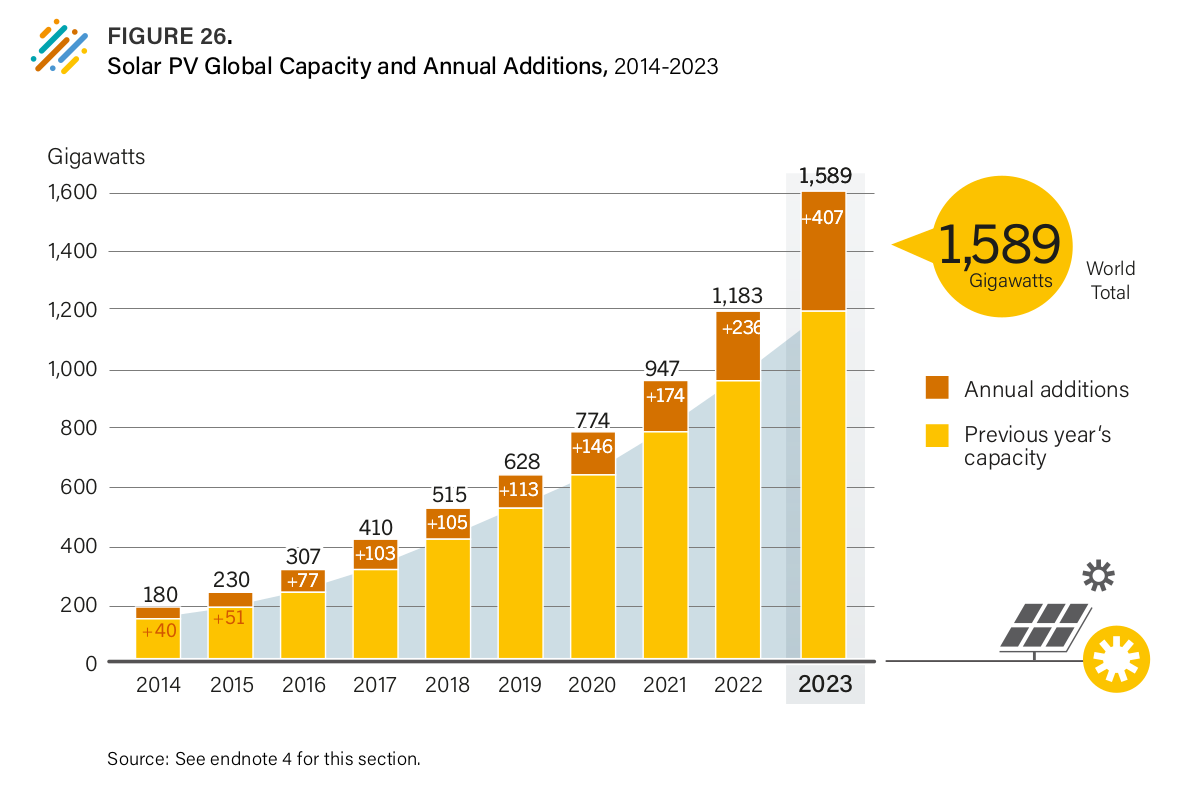
Solar PV capacity trend
Solar PV capacity trend per country
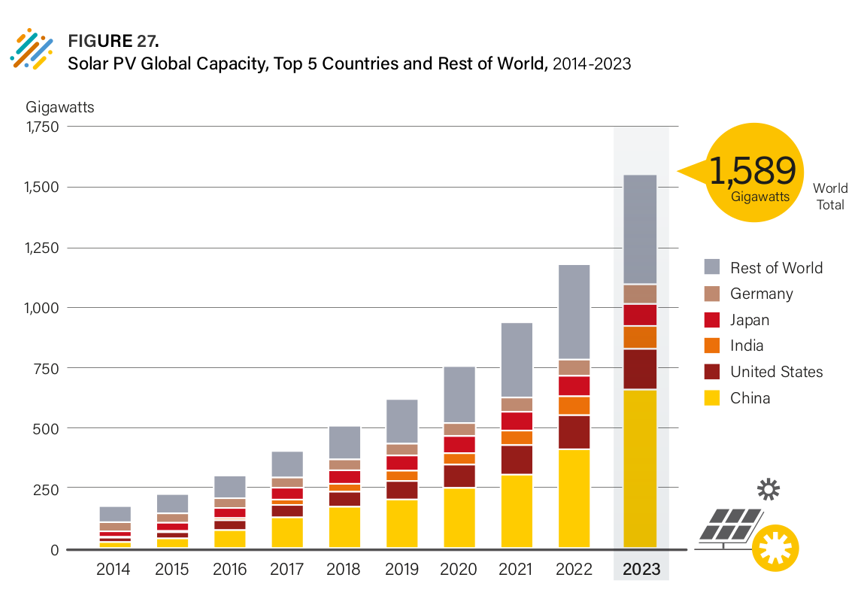
Global share + trend
Solar: global distribution share + trend
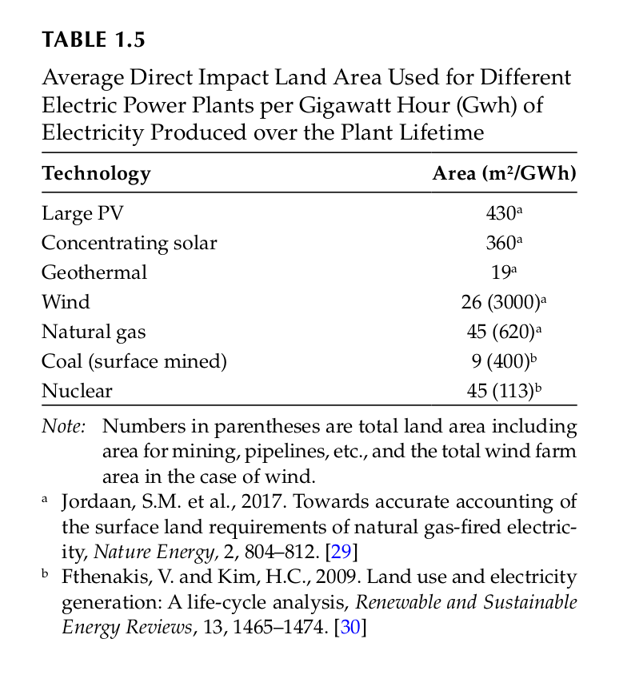
Land needed to satisfy Dutch electricity demand?
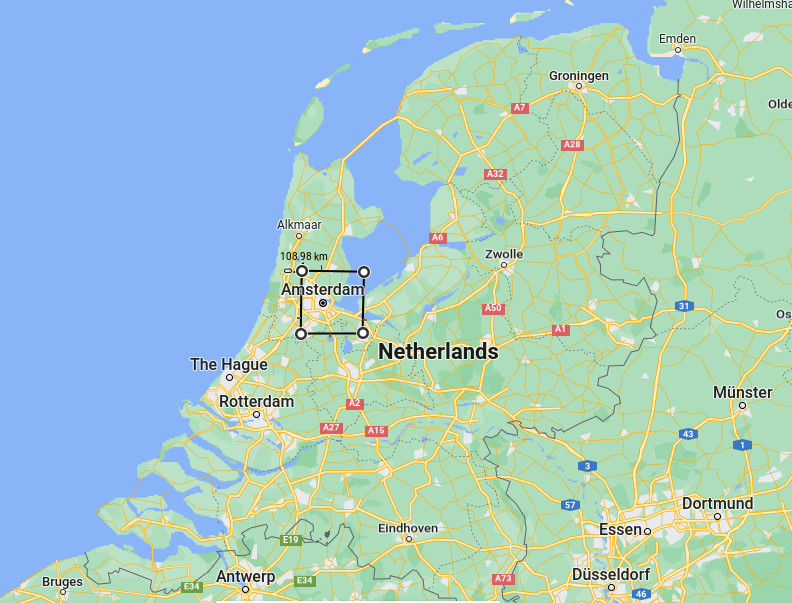
Land needed to satisfy Dutch electricity demand?
But electricity is only 17.8% of Dutch energy consumption.
Then again #1: use same space?
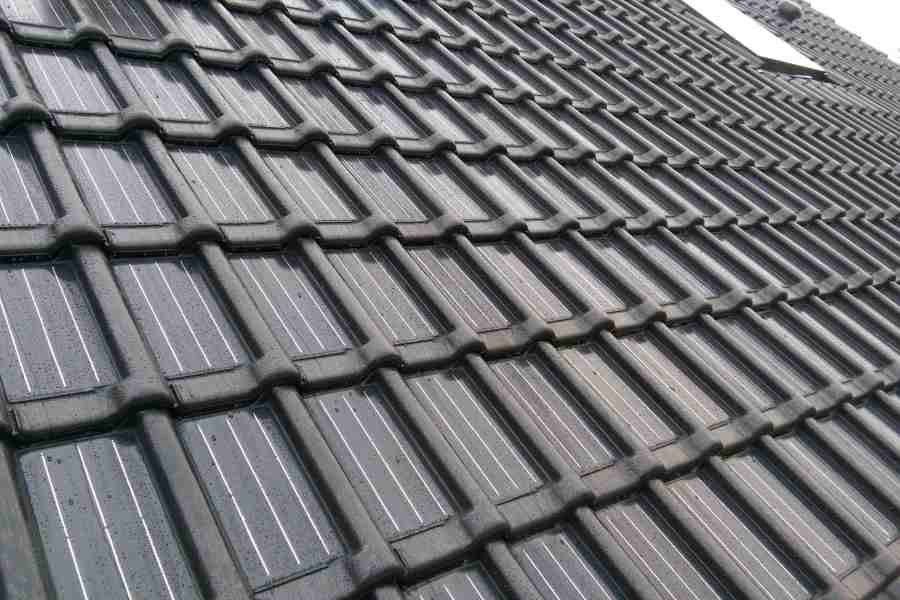
Then again #1: use same space?
Then again #2: what about fossil fuels?
Costs
Hydro
Hydro power capacity + trend
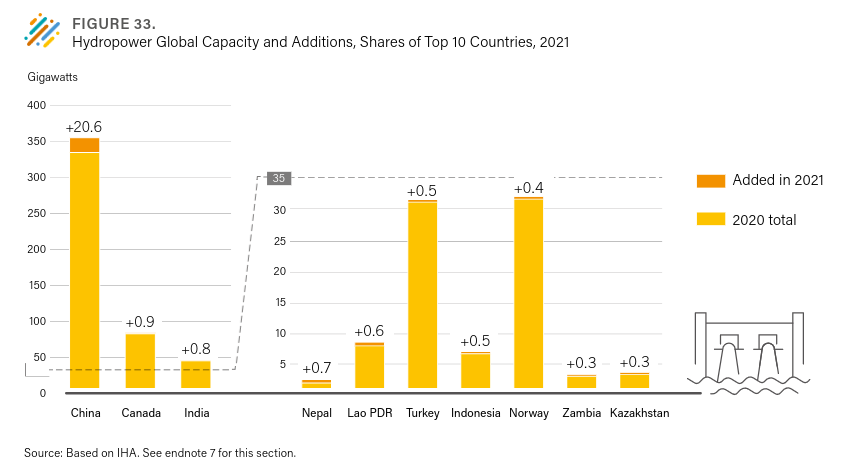
Global share + trend
Hydro: global distribution share + trend
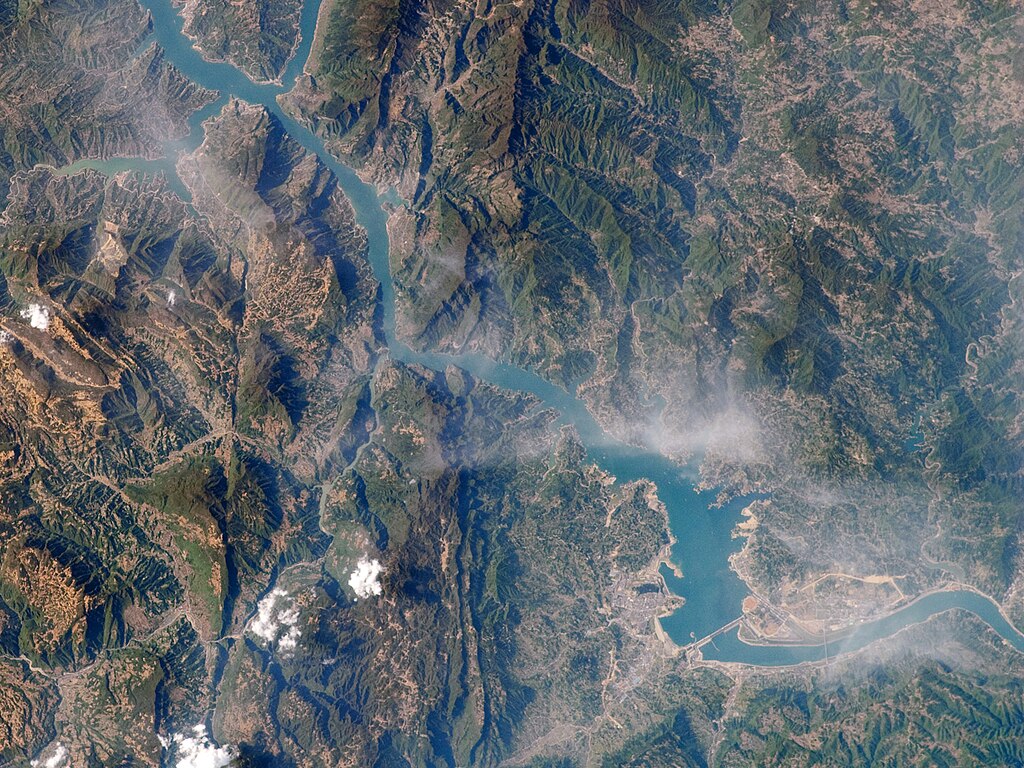
Three gorges dam
Highly reliable
Storage capacity
Turn off-and-turn-on-able (?)
Geographic availability?
Environmental and social costs
Environmental and social costs
Environmental and social costs